NRTR_Pilot911_v1
Download script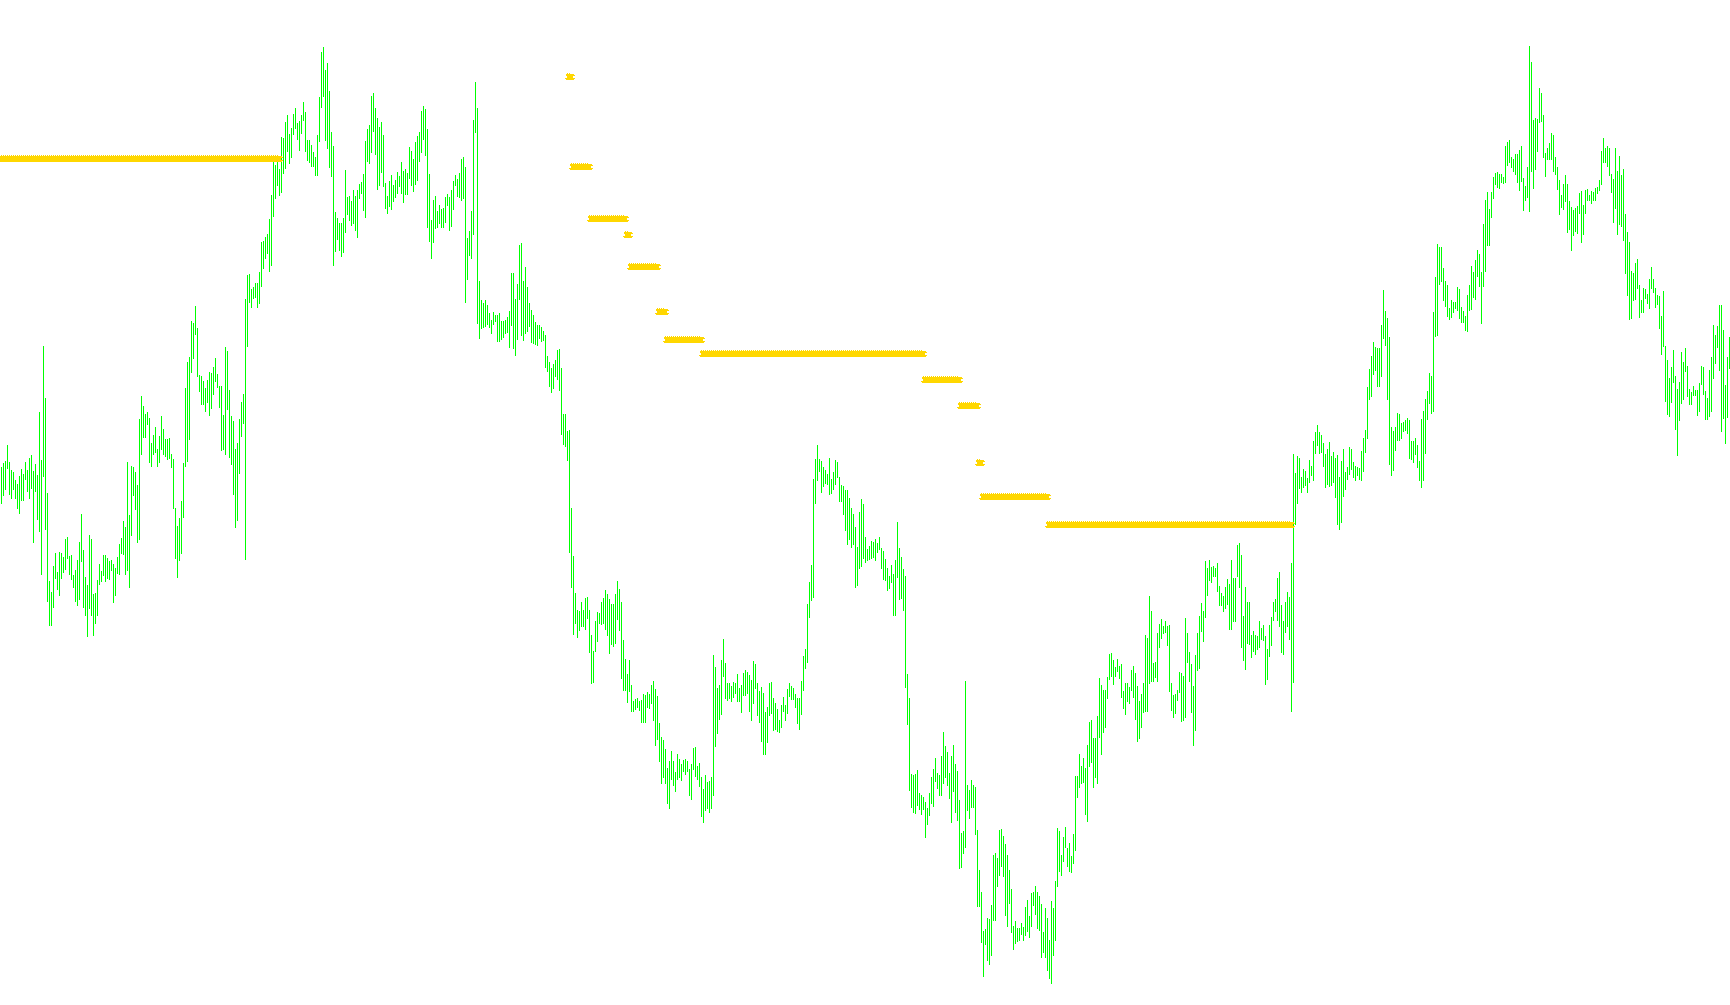
This script is a specialized technical analysis tool designed for the MetaTrader platform to help traders identify market trends and potential reversal points. It works by calculating a dynamic "buffer zone" based on recent price volatility and then monitoring price action to determine whether the market is moving in an upward or downward direction.
Core Logic Overview
The indicator functions by measuring the average range of price movement over a specific period (defaulted to 40 candles). By understanding how much the price typically fluctuates, the script establishes a mathematical threshold used to filter out "noise" and identify significant structural shifts in the market.
Depending on your settings, the script uses one of two primary methods to interpret these trends:
1. Open-Close Price Tracking
When the primary setting is enabled, the script looks at the relationship between the opening and closing prices of the candles.
- Trend Detection: If a candle closes higher than it opened, the script views this as bullish momentum. If it closes lower, it views it as bearish.
- The "Breakout" Rule: The logic doesn't just switch trends on every small movement. Instead, it tracks the highest/lowest price points reached during a trend. It only registers a trend reversal if the price breaks significantly beyond the calculated average volatility buffer. If the price stays within that buffer, the script assumes the current trend is still intact.
2. High-Low Midpoint Tracking
Alternatively, the script can be configured to ignore the opening and closing prices entirely, focusing instead on the midpoint of each candle (the average of the high and low).
- Midpoint Analysis: This method looks for shifts in the "center of gravity" of the price action.
- Reversal Logic: Similar to the first method, it monitors whether these midpoints are steadily rising or falling. A trend reversal is only signaled when a new midpoint fails to stay above (in an uptrend) or below (in a downtrend) the established volatility boundary.
Visual Output
The script translates this logic into four distinct visual markers on your chart:
- Buy Signals: These appear when the logic identifies a confirmed upward trend shift.
- Sell Signals: These appear when the logic identifies a confirmed downward trend shift.
- Stop-Loss Reference Points: The script also calculates specific price levels (labeled as Buy/Sell S/L) which represent the technical boundaries of the trend. These serve as visual guides for where a trend might be considered "broken" or exhausted.
Summary for Traders
In simple terms, this script acts as a trend-following filter. Rather than reacting to every tiny tick in price, it measures the "normal" breathing room of the market and only provides signals when the price moves with enough strength to break out of that normal range, helping traders stay on the right side of the prevailing momentum.
/*-----------------------------+
|			       |
| Shared by www.Aptrafx.com    |
|			       |
+------------------------------*/

//+------------------------------------------------------------------+
//|                                                         NRTR.mq4 |
//|            Copyright © 2005, VG many thanks to Konkop and dupidu |
//|                                                      4vg@mail.ru |
//+------------------------------------------------------------------+
#property copyright "VG many thanks to Konkop and dupidu"

#property indicator_chart_window
#property  indicator_buffers 4
#property  indicator_color1  Blue
#property  indicator_color2  Red
#property  indicator_color3  Magenta
#property  indicator_color4  Yellow


double     ind_buffer1[];
double     ind_buffer2[];
double     ind_buffer3[];
double     ind_buffer4[];

extern double AveragePeriod = 40;
extern bool OCnotAverage = true;
//+------------------------------------------------------------------+
//| Custom indicator initialization function                         |
//+------------------------------------------------------------------+
int init()
  {
//---- drawing settings
   SetIndexStyle(0,DRAW_ARROW,STYLE_SOLID,1);
   SetIndexDrawBegin(0,AveragePeriod);
   SetIndexStyle(1,DRAW_ARROW,STYLE_SOLID,1);
   SetIndexDrawBegin(1,AveragePeriod);
   SetIndexStyle(2,DRAW_ARROW,STYLE_SOLID,3);
   SetIndexDrawBegin(2,AveragePeriod);
   SetIndexStyle(3,DRAW_ARROW,STYLE_SOLID,3);
   SetIndexDrawBegin(3,AveragePeriod);

//---- indicator buffers mapping
   if(!SetIndexBuffer(0,ind_buffer1) && !SetIndexBuffer(1,ind_buffer2)
      && !SetIndexBuffer(2,ind_buffer3)&& !SetIndexBuffer(3,ind_buffer4))
      Print("cannot set indicator buffers!");
//---- name for DataWindow and indicator subwindow label
   IndicatorShortName("NRTR");
   SetIndexLabel(0,"Sell");
   SetIndexLabel(1,"Buy");
   SetIndexLabel(2,"Sell S/L");
   SetIndexLabel(3,"Buy S/L");

//---- initialization done
   return(0);
  }
//+------------------------------------------------------------------+
//| Custor indicator deinitialization function                       |
//+------------------------------------------------------------------+
int deinit()
  {
//---- TODO: add your code here

//----
   return(0);
  }
//+------------------------------------------------------------------+
//| Custom indicator iteration function                              |
//+------------------------------------------------------------------+
int start()
  {
   int counted_bars=IndicatorCounted();
   int bar;
   double value = 0;
   double price = 0;
   double trend, dK, AvgRange, HLTrend;
   int SetLoopCount = 0;
//---- TODO: add your code here
for (int shift=Bars-2; shift>=0; shift--)
    {
    ind_buffer1[shift]=0;
    ind_buffer2[shift]=0;
    ind_buffer3[shift]=0;
    ind_buffer4[shift]=0;
    }

AvgRange=0;
for (int i=1; i<=AveragePeriod; i++) AvgRange+= MathAbs(High[i]-Low[i]);
dK = AvgRange/AveragePeriod/Point/10000;

if (OCnotAverage)
{
if (Close[Bars-1] > Open[Bars-1])
   {
   value = Close[Bars - 1] * (1 - dK);
   trend = 1;
   ind_buffer2[Bars - 1] = value;
   }
if (Close[Bars-1] < Open[Bars-1])
   {
   value = Close[Bars - 1] * (1 + dK);
   trend = -1;
   ind_buffer1[Bars - 1] = value;
   }
for (bar = Bars - 2; bar >= 0; bar--)
    {
    if (trend >= 0)
       {
       if (Low[bar] > price)  price = Close[bar];
       value = price * (1 - dK);
       if (Close[bar] < value)
          {
          price = Close[bar];
          value = price * (1 + dK);
          trend = -1;
          }
       }
    else
    if (trend <= 0)
       {
       if (High[bar] < price) price = Close[bar];
       value = price * (1 + dK);
       if (Close[bar] > value)
          {
          price = Close[bar];
          value = price * (1 - dK);
          trend = 1;
          }
       }
    if (trend == -1) ind_buffer1[bar] = value;
    if (trend == 1) ind_buffer2[bar] = value;
    }
}
else
{
if ((High[Bars-1] + Low[Bars-1])/2 > (High[Bars-2] + Low[Bars-2])/2)
   {
   value = (High[Bars-1] + Low[Bars-1])/2 * (1 - dK);
   HLTrend = 1;
   ind_buffer4[Bars - 1] = value;
   }
   else
   {
   value = (High[Bars-1] + Low[Bars-1])/2 * (1 + dK);
   HLTrend = -1;
   ind_buffer3[Bars - 1] = value;
   }
for (bar = Bars - 2; bar >= 0; bar--)
    {
    if (HLTrend >= 0)
       {
       if (Low[bar] > price) price = (High[bar] + Low[bar])/2;
       value = price * (1 - dK);
       if ((High[bar] + Low[bar])/2 < value)
          {
          price = (High[bar] + Low[bar])/2;
          value = price * (1 + dK);
          HLTrend = -1;
          }
       }
    else
    if (HLTrend <= 0)
       {
       if (High[bar] < price) price = (High[bar] + Low[bar])/2;
       value = price * (1 + dK);
       if ((High[bar] + Low[bar])/2 > value)
          {
          price = (High[bar] + Low[bar])/2;
          value = price * (1 - dK);
          HLTrend = 1;
          }
       }
    if (HLTrend == -1) ind_buffer3[bar] = value;
    if (HLTrend == 1) ind_buffer4[bar] = value;
    }
}

//----
   return(0);
  }
//+------------------------------------------------------------------+
Comments