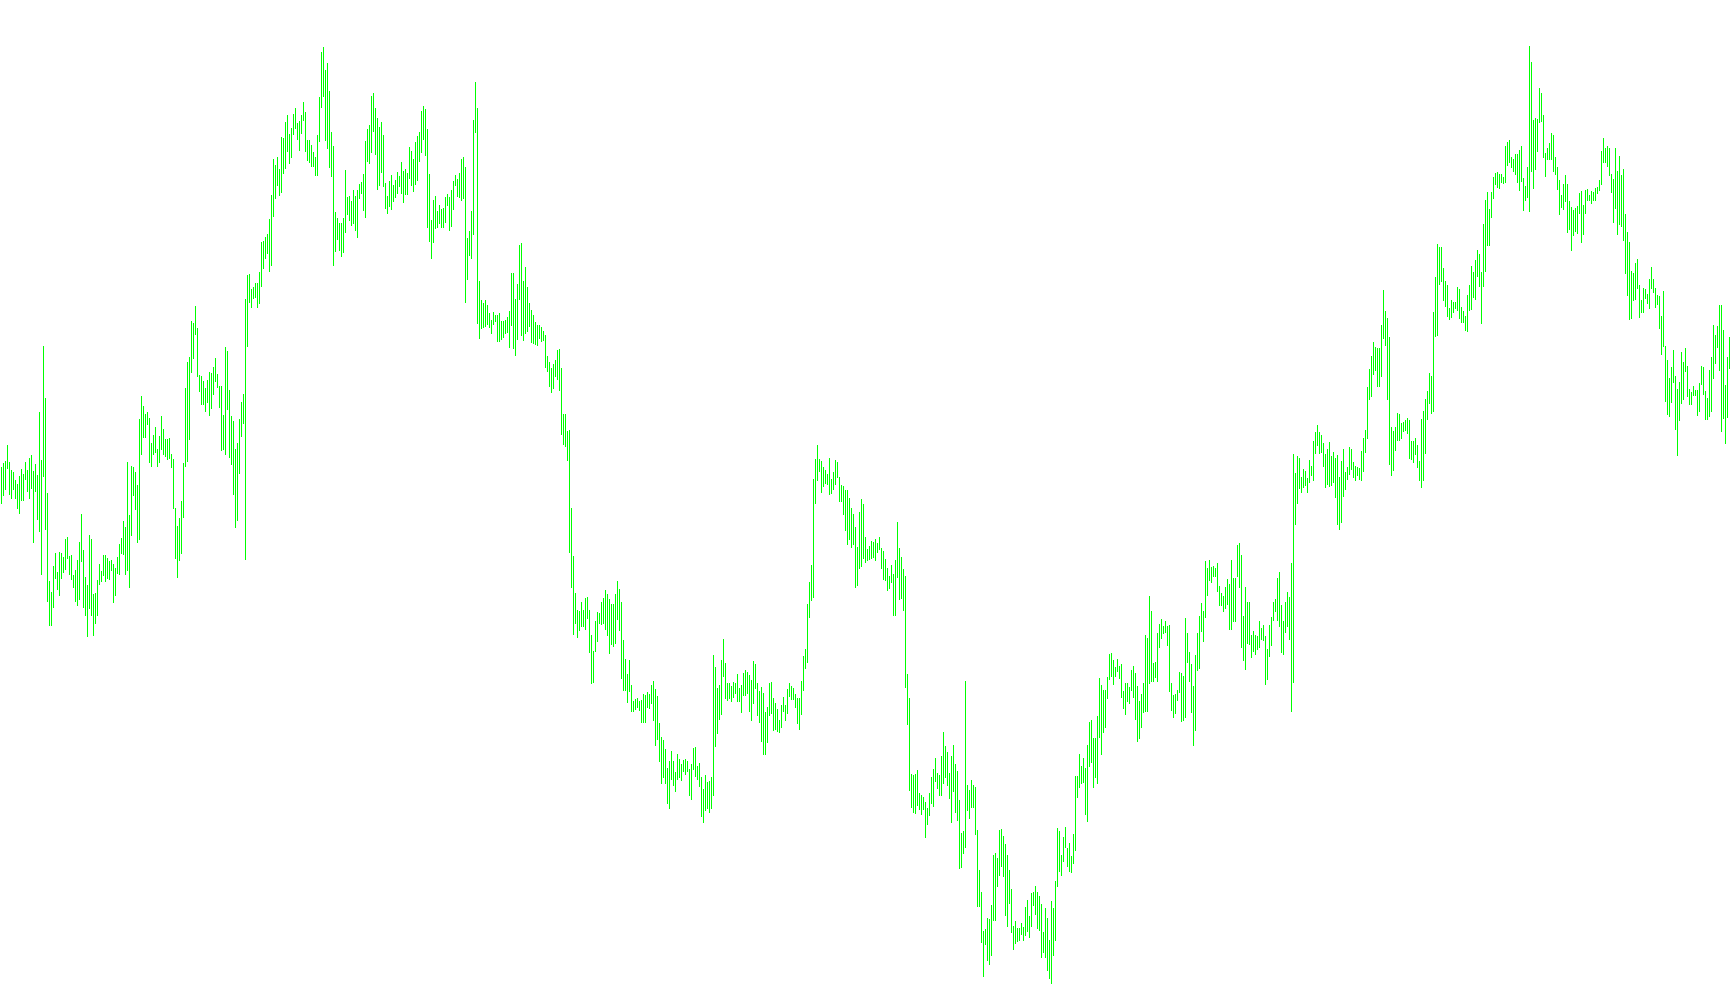
This script is designed for traders who need to visualize the price action of a secondary currency pair (a "Sub-Symbol") directly on top of their primary chart. Instead of requiring the user to switch between different windows, this tool overlays the data of a second asset, allowing for a simultaneous comparison of market movements in real-time.
Core Logic and Functionality
1. Dynamic Data Mapping The script identifies the specific price range of both your current chart and the chosen secondary symbol. It then calculates a mathematical "Ratio" between the two. This ensures that even though the two assets have different price values (for example, one might be at 1.1000 while another is at 2000.00), they are scaled proportionally so that their movements appear synchronized and readable on the same screen.
2. Visual Representation of Price Action Once the data is scaled, the script "draws" the candlesticks of the secondary symbol onto your current chart. It distinguishes between "Bullish" (upward moving) and "Bearish" (downward moving) price action using specific colors. This allows you to see exactly how the second asset is behaving relative to your main trade at any given moment.
3. Mirroring Capability The logic includes an optional mirroring feature. When enabled, it flips the orientation of the secondary symbol’s price action. This is particularly useful for identifying inverse correlations—where one currency moves up while another moves down.
4. Automatic Grid and Pricing To make the overlaid data easy to read, the script automatically generates a visual grid across your chart based on the secondary symbol's price levels. It calculates these grid lines dynamically and places text labels on them so you can identify specific price points of the second asset without looking at a separate window.
5. Real-Time Information Display The tool provides an on-screen status update that displays the current Open, High, Low, and Close prices for the secondary symbol. This ensures you have a constant feed of raw data for the overlay asset as it updates with every tick of the market.
Key Features Summary
- Multi-Asset Visibility: View two different markets in one window.
- Proportional Scaling: Automatically adjusts the size of the second asset to fit your current screen view perfectly.
- Visual Clarity: Uses color-coded bars and dotted grid lines to ensure the overlay is organized and easy to interpret.
- Correlation Analysis: Simplifies the process of spotting how different currency pairs react to global economic events simultaneously.
//+------------------------------------------------------------------+
//|                                       OverLay Chart.mq4 Ver.1.10 |
//|                                      Copyright© 2006-2007 S.B.T. |
//|                                     http://sufx.core.t3-ism.net/ |
//+------------------- DO NOT REMOVE THIS HEADER --------------------+
//|  This script is free to use/distribute/modify and re-distribute. |
//|                                  (Limited to noncommercial use.) |
//+------------------------------------------------------------------+

//Indicator Properties
#property copyright "Copyright© 2006 S.B.T."
#property link      "http://sufx.core.t3-ism.net/"
#property indicator_chart_window
#property indicator_buffers 4


//Indicator Parameters
extern string SubSymbol = "USDJPY";
extern color BullBarColor = MediumSeaGreen;
extern color BearBarColor = Orange;
extern color GridColor = Black;
extern bool Mirroring = false;

//Global Variables
string Prefix; //Indicator Prefix
int Grid = 10; //Grid Lines
int SnapPips = 10;  //Snap Pips For Grid Lines


//Indicator Buffers
double ExtMapBuffer1[];
double ExtMapBuffer2[];
double ExtMapBuffer3[];
double ExtMapBuffer4[];


//+------------------------------------------------------------------+
//| Custom indicator initialization function                         |
//+------------------------------------------------------------------+
int init() {

   //Initialize Indexes
   Prefix = "OverLayChart" + SubSymbol;

   IndicatorShortName( "OverLay Chart( " + SubSymbol + " )" );

   SetIndexBuffer( 0, ExtMapBuffer1 );
   SetIndexBuffer( 1, ExtMapBuffer2 );
   SetIndexBuffer( 2, ExtMapBuffer3 );
   SetIndexBuffer( 3, ExtMapBuffer4 );

   SetIndexStyle( 0, DRAW_HISTOGRAM, DRAW_LINE, 1, BullBarColor );
   SetIndexStyle( 1, DRAW_HISTOGRAM, DRAW_LINE, 1, BearBarColor );
   SetIndexStyle ( 2, DRAW_HISTOGRAM, DRAW_LINE, 3, BullBarColor );
   SetIndexStyle( 3, DRAW_HISTOGRAM, DRAW_LINE, 3, BearBarColor );

   SetIndexEmptyValue( 0, 0.0 );
   SetIndexEmptyValue( 1, 0.0 );
   SetIndexEmptyValue( 2, 0.0 );
   SetIndexEmptyValue( 3, 0.0 );


   return( 0 );
}


//+------------------------------------------------------------------+
//| Custom indicator deinitialization function                       |
//+------------------------------------------------------------------+
int deinit() {
   int _i;


   //Delete Objects
	ObjectDelete( Prefix + "Status" );
	ObjectDelete( Prefix + "Copyright" );

	for ( _i = 1; _i <= Grid ; _i ++ ) {
   	ObjectDelete( Prefix + "Grid" + _i );
   	ObjectDelete( Prefix + "Price" + _i );
   }


   return( 0 );
}


//+------------------------------------------------------------------+
//| Custom indicator iteration function                              |
//+------------------------------------------------------------------+
int start() {
   int _BarsCount;
   double _CurRangeHigh, _CurRangeLow, _CurRangeCenter;
   double _SubRangeHigh, _SubRangeLow, _SubRangeCenter;
   double _SubPoint, _SubDigit;
   double _SubOpen, _SubHigh, _SubLow, _SubClose;
   double _PipsRatio;
   double _GridPips, _GridPrice;
   int _i;


   //Initialize Buffers
	RefreshRates();

   ArrayInitialize( ExtMapBuffer1, 0.0 );
   ArrayInitialize( ExtMapBuffer2, 0.0 );
   ArrayInitialize( ExtMapBuffer3, 0.0 );
   ArrayInitialize( ExtMapBuffer4, 0.0 );


   //Calculate Visible Bars
   _BarsCount = BarsPerWindow() + 1;
   int _FirstBar = FirstVisibleBar();
   int _LastBar = _FirstBar - _BarsCount + 1;
   if ( _LastBar < 0 ) {
      _LastBar = 0;
      _BarsCount = _FirstBar + 1;
   }


   //Calculate Chart Ratio
   _CurRangeHigh = High[Highest(NULL, 0, MODE_HIGH, _BarsCount, _LastBar)];
   _CurRangeLow = Low[Lowest(NULL, 0, MODE_LOW, _BarsCount, _LastBar)];
   _CurRangeCenter = ( _CurRangeHigh + _CurRangeLow ) / 2;

   if ( Mirroring ) {
      _SubRangeHigh = iLow( SubSymbol, 0, Lowest( SubSymbol, 0, MODE_LOW, _BarsCount, _LastBar ) );
      _SubRangeLow = iHigh( SubSymbol, 0, Highest( SubSymbol, 0, MODE_HIGH, _BarsCount, _LastBar ) );
   } else {
      _SubRangeHigh = iHigh( SubSymbol, 0, Highest( SubSymbol, 0, MODE_HIGH, _BarsCount, _LastBar ) );
      _SubRangeLow = iLow( SubSymbol, 0, Lowest( SubSymbol, 0, MODE_LOW, _BarsCount, _LastBar ) );
   }

   _SubRangeCenter = ( _SubRangeHigh + _SubRangeLow ) / 2;
   _SubPoint = MarketInfo( SubSymbol, MODE_POINT );
   _SubDigit = MarketInfo( SubSymbol, MODE_DIGITS );

   _PipsRatio = ( _CurRangeHigh - _CurRangeLow )  / ( _SubRangeHigh - _SubRangeLow );

   _GridPips = ( _SubRangeHigh - _SubRangeLow ) / Grid;
   _GridPips = MathRound( ( _SubRangeHigh - _SubRangeLow ) / Grid / ( _SubPoint * SnapPips ) ) * ( _SubPoint * SnapPips );


   //Draw Candlesticks
	for ( _i = _LastBar; _i < _LastBar + _BarsCount; _i ++ ) {
      _SubOpen = iOpen( SubSymbol, 0, _i ) - _SubRangeCenter;
      _SubHigh = iHigh( SubSymbol, 0, _i ) - _SubRangeCenter;
      _SubLow = iLow( SubSymbol, 0, _i ) - _SubRangeCenter;
      _SubClose = iClose( SubSymbol, 0, _i ) - _SubRangeCenter;

      if ( Mirroring ) {
         if ( _SubOpen < _SubClose ) {
            ExtMapBuffer2[_i] = _CurRangeCenter + _SubHigh * _PipsRatio;
            ExtMapBuffer1[_i] = _CurRangeCenter + _SubLow * _PipsRatio;
         } else {
            ExtMapBuffer2[_i] = _CurRangeCenter + _SubLow * _PipsRatio;
            ExtMapBuffer1[_i] = _CurRangeCenter + _SubHigh * _PipsRatio;
         }

         ExtMapBuffer4[_i] = _CurRangeCenter + _SubClose * _PipsRatio;
         ExtMapBuffer3[_i] = _CurRangeCenter + _SubOpen * _PipsRatio;
      } else {
         if ( _SubOpen < _SubClose ) {
            ExtMapBuffer1[_i] = _CurRangeCenter + _SubHigh * _PipsRatio;
            ExtMapBuffer2[_i] = _CurRangeCenter + _SubLow * _PipsRatio;
         } else {
            ExtMapBuffer1[_i] = _CurRangeCenter + _SubLow * _PipsRatio;
            ExtMapBuffer2[_i] = _CurRangeCenter + _SubHigh * _PipsRatio;
         }
         ExtMapBuffer3[_i] = _CurRangeCenter + _SubClose * _PipsRatio;
         ExtMapBuffer4[_i] = _CurRangeCenter + _SubOpen * _PipsRatio;
      }
   }


   //Draw Objects
   ObjectCreate( Prefix + "Copyright", OBJ_LABEL, 0, 0, 0 );
	ObjectSet( Prefix + "Copyright", OBJPROP_COLOR, GridColor );
   ObjectSet( Prefix + "Copyright", OBJPROP_CORNER, 3 );
   ObjectSet( Prefix + "Copyright", OBJPROP_XDISTANCE, 4 );
   ObjectSet( Prefix + "Copyright", OBJPROP_YDISTANCE, 4 );
   ObjectSetText( Prefix + "Copyright", "OverLay Chart by S.B.T.", 8 );

   ObjectCreate( Prefix + "Status", OBJ_LABEL, 0, 0, 0 );
	ObjectSet( Prefix + "Status", OBJPROP_COLOR, GridColor );
   ObjectSet( Prefix + "Status", OBJPROP_CORNER, 0 );
   ObjectSet( Prefix + "Status", OBJPROP_XDISTANCE, 4 );
   ObjectSet( Prefix + "Status", OBJPROP_YDISTANCE, 16 );
   ObjectSetText( Prefix + "Status",
                  SubSymbol + " O = " + DoubleToStr( iOpen( SubSymbol, 0, _LastBar ), _SubDigit ) +
                  ", H = " + DoubleToStr( iHigh( SubSymbol, 0, _LastBar ), _SubDigit ) +
                  ", L = " + DoubleToStr( iLow( SubSymbol, 0, _LastBar ), _SubDigit ) +
                  ", C = " + DoubleToStr( iClose( SubSymbol, 0, _LastBar ), _SubDigit ),
                  8 );

	for ( _i = 1; _i <= Grid ; _i ++ ) {
      _GridPrice = MathRound( _SubRangeCenter / ( _SubPoint * SnapPips ) ) * ( _SubPoint * SnapPips );
      _GridPrice = ( ( _GridPrice + _GridPips / 2 ) + _GridPips * ( Grid / 2 - 1 ) ) - ( _GridPips * ( _i - 1 ) );

		ObjectCreate( Prefix + "Grid" + _i, OBJ_TREND, 0, 0, 0 );
      ObjectSet( Prefix + "Grid" + _i, OBJPROP_TIME1, Time[_FirstBar] );
      ObjectSet( Prefix + "Grid" + _i, OBJPROP_PRICE1, _CurRangeCenter + ( _GridPrice - _SubRangeCenter ) * _PipsRatio );
      ObjectSet( Prefix + "Grid" + _i, OBJPROP_TIME2, Time[_LastBar] );
      ObjectSet( Prefix + "Grid" + _i, OBJPROP_PRICE2, _CurRangeCenter + ( _GridPrice - _SubRangeCenter ) * _PipsRatio );
		ObjectSet( Prefix + "Grid" + _i, OBJPROP_COLOR, GridColor );
		ObjectSet( Prefix + "Grid" + _i, OBJPROP_STYLE, STYLE_DOT );
		ObjectSet( Prefix + "Grid" + _i, OBJPROP_WIDTH, 1 );
		ObjectSet( Prefix + "Grid" + _i, OBJPROP_RAY, true );

		ObjectCreate( Prefix + "Price" + _i, OBJ_TEXT, 0, 0, 0 );
      ObjectSet( Prefix + "Price" + _i, OBJPROP_TIME1, Time[_FirstBar - _BarsCount / 10] );
      ObjectSet( Prefix + "Price" + _i, OBJPROP_PRICE1, _CurRangeCenter + ( _GridPrice - _SubRangeCenter ) * _PipsRatio );
		ObjectSet( Prefix + "Price" + _i, OBJPROP_COLOR, GridColor );
      ObjectSetText( Prefix + "Price" + _i, DoubleToStr( _GridPrice, _SubDigit ), 8 );
   }


   return( 0 );
}
//+------------------------------------------------------------------+
Comments