Parabolic SAR Color - Alert(2)email
Download script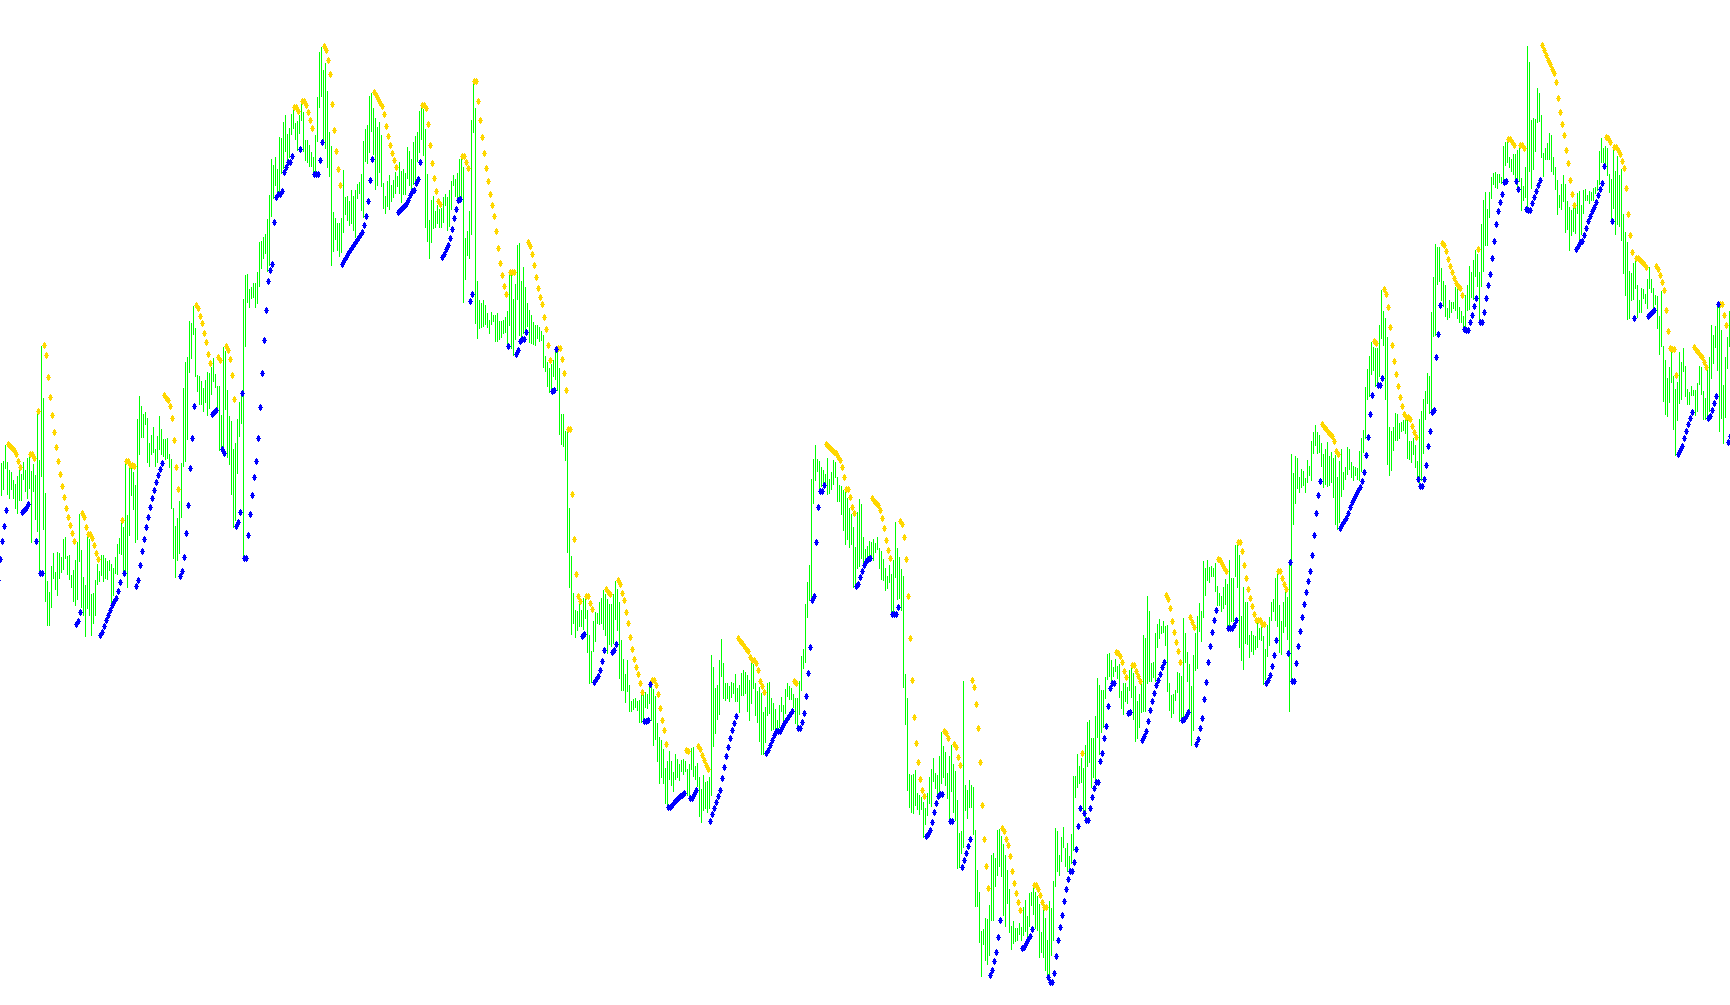
This tool is designed as a visual aid for traders using the MetaTrader platform to identify trend reversals in financial markets. It enhances the standard Parabolic SAR (Stop and Reverse) indicator by providing clear, color-coded signals that help distinguish between upward and downward market movements.
Core Functionality
The primary purpose of this script is to monitor price action relative to the Parabolic SAR values. Instead of simply plotting a line, it categorizes the market state into two distinct types:
- Bullish Trends (Up Channel): When the indicator detects an upward trend, it marks the data with a specific color (Dark Green) to signify a positive momentum.
- Bearish Trends (Down Channel): When the indicator detects a downward trend, it switches the visual representation to another color (Red), signaling negative momentum.
How the Logic Works
The script constantly scans the most recent price data (the high and low points of current candles) and compares them against calculated SAR values based on user-defined sensitivity settings (Step and Maximum).
- Trend Detection: The logic checks if the Parabolic SAR value has moved above or below the current price peak.
- Visual Switching: Once a crossover occurs, the script "flips" the visual signal. It clears out the previous trend's data and populates the chart with the new direction.
- Alert System: To ensure traders don't miss critical moments, the script includes an automated notification system. When a trend reversal is detected (the SAR switches from Up to Down or vice versa), it can trigger several types of alerts:
- On-Screen Pop-ups: Immediate visual alerts on the trading platform.
- Email Notifications: Optional alerts sent directly to your email address.
User Experience
For a trader, this means the chart becomes much easier to read at a glance. Rather than having to interpret complex mathematical dots, you get a clear, color-coded visual representation of whether the current market trend is "Up" or "Down." The automated alerts serve as a secondary layer of protection, notifying you the exact moment the momentum shifts so you can react quickly to changing market conditions.
//+------------------------------------------------------------------+
//|                                                    SAR_COLOR.mq4 |
//|                                                          Kalenzo |
//|                                       http://www.foreksik.prv.pl |
//+------------------------------------------------------------------+
#property copyright "Kalenzo"
#property link      "http://www.foreksik.prv.pl"

#property indicator_color1 DarkGreen
#property indicator_color2 Red
#property indicator_chart_window
#property indicator_buffers 2
#property indicator_width1 2
#property indicator_width2 2

double sarUp[],sarDn[];//buffers

extern double Step = 0.04;//was .01
extern double Maximum = 0.5;
extern int Precision = 7;
extern bool AlertsEnabled=true;
extern bool AlertBox= true;
extern bool AlertEmail= false;
double alertBar;
//+------------------------------------------------------------------+
//| Custom indicator initialization function                         |
//+------------------------------------------------------------------+
int init()
  {
//---- indicators
   SetIndexStyle(0,DRAW_ARROW,STYLE_DOT);
   SetIndexStyle(1,DRAW_ARROW,STYLE_DOT);
   SetIndexBuffer(0,sarUp);
   SetIndexBuffer(1,sarDn);
   SetIndexArrow(0,115);
   SetIndexArrow(1,115);

   IndicatorShortName("SAR COLORED");
   SetIndexLabel(0,"SAR Up Channel");
   SetIndexLabel(1,"SAR Down Channel");

   SetIndexDrawBegin(0,2);
   SetIndexDrawBegin(1,2);
//----
   return(0);
  }
//+------------------------------------------------------------------+
//| Custor indicator deinitialization function                       |
//+------------------------------------------------------------------+
int deinit()
  {
//----

//----
   return(0);
  }
//+------------------------------------------------------------------+
//| Custom indicator iteration function                              |
//+------------------------------------------------------------------+
int start()
  {

   int limit;
   int counted_bars=IndicatorCounted();
   if(counted_bars<0) counted_bars=0;
   if(counted_bars>0) counted_bars--;
   limit=Bars-counted_bars;
//----
  for(int i = 0; i<limit ;i++)
   {
      double sar = NormalizeDouble(iSAR(Symbol(),0,Step,Maximum,i),Precision);
          if(sar >= iHigh(Symbol(),0,i))
      {
       if(AlertsEnabled==true && sarUp[i] == 0 && Bars>alertBar)
        {
       if (AlertBox)
       Alert("Parabolic SAR Going Down on ",Symbol()," M",Period());
       if (AlertEmail)
       SendMail("Parabolic SAR Going Down on ",Symbol()+" M"+Period()+" at"+Bid );
         alertBar = Bars;
       }
         sarUp[i] = sar;
         sarDn[i] = 0;
      }
    else
      {
       if(AlertsEnabled==true && sarDn[i] == 0 && Bars>alertBar)
        {
        Alert("Parabolic SAR Channel Going Up on ",Symbol()," M",Period());
        SendMail("Parabolic SAR Going Up on ",Symbol()+" M"+Period()+" at"+Bid);

        alertBar = Bars;
        }
         sarUp[i] = 0;
         sarDn[i] = sar;
       }
   }
 //----
   return(0);
  }
//+------------------------------------------------------------------+
Comments