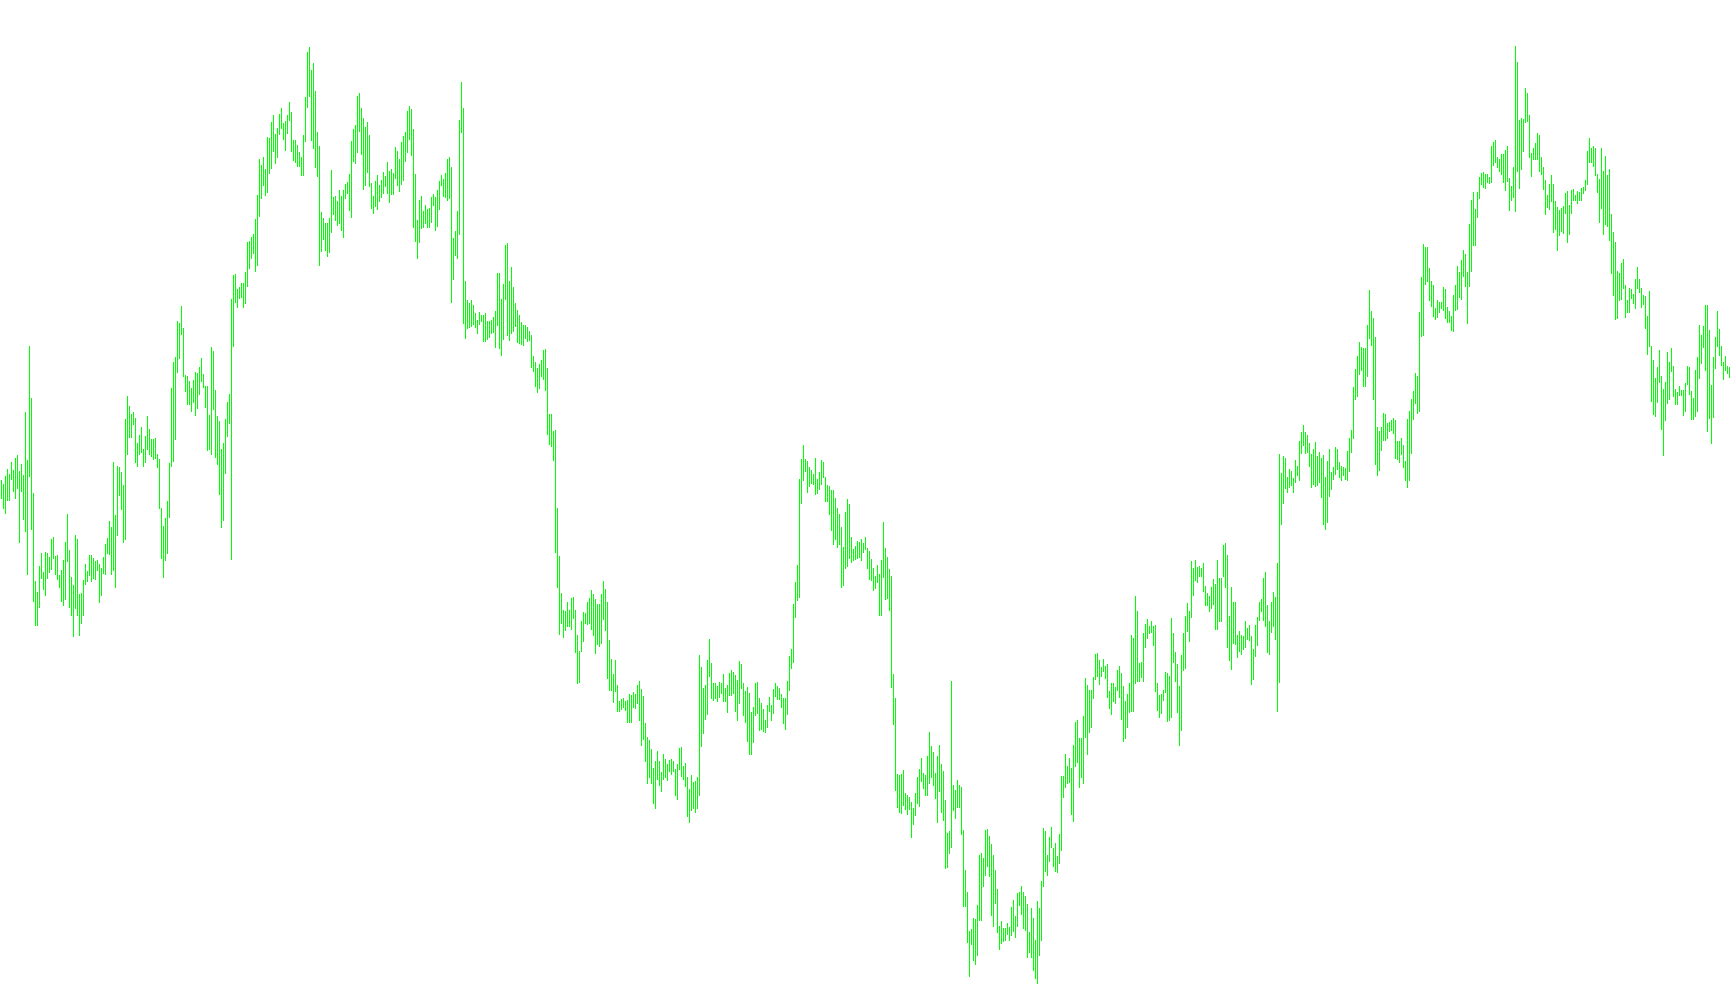
The SAR COLORED indicator is designed to provide traders with a clear, visual representation of market momentum by tracking the movement of the Parabolic Sarangan (PSAR) trend. Instead of showing a standard trend line, this tool focuses on identifying specific "flips" in market direction and alerts the user the moment those shifts occur.
Core Logic and Functionality
The script operates by analyzing the relationship between the standard Parabolic SAR calculation and the high price points of the current market candles. Here is how the logic flows:
1. Trend Identification & Color Coding The tool monitors two distinct states of the market trend:
- Downward Trend (Magenta): When the calculated SAR value sits above the actual high price of a candle, the indicator recognizes a downward movement and marks it with Magenta dots.
- Upward Trend (Yellow): When the SAR value falls below the high price of a candle, the indicator identifies an upward movement and marks it with Yellow dots.
2. Dynamic State Switching The script is programmed to "remember" its current state to ensure clarity. It tracks whether the trend is currently moving up or down. This prevents repetitive signals; it will only trigger a notification when the trend actually reverses from one direction to the other.
3. Real-Time Alerts One of the primary features of this script is its automated notification system. The logic is set up to perform the following actions:
- It monitors for the exact moment the SAR value crosses the price threshold.
- When a "flip" occurs (e.g., switching from an upward trend to a downward trend), the script triggers a pop-up alert on the trading platform.
- The alert specifically names the currency pair and the timeframe currently being viewed, allowing for quick reaction to market changes.
User Customization
The logic includes several adjustable parameters that allow users to fine-tune how the indicator behaves:
- Step & Maximum: These define the sensitivity of the Parabolic SAR calculation, determining how quickly the dots react to price movements.
- Precision: Ensures the mathematical accuracy of the values displayed on the chart.
- SoundON: A simple toggle that allows users to enable or disable the audible and visual alerts based on their trading preferences.
Summary for the Trader
In essence, this tool acts as a visual "traffic light" for price action. By converting complex trend calculations into distinct colors (Magenta for down, Yellow for up) and providing instant notifications upon a trend reversal, it helps traders identify potential entry or exit points more efficiently without needing to manually interpret the raw data of the Parabolic SAR.
//+------------------------------------------------------------------+
//|                                                    SAR_COLOR.mq4 |
//|                                                          Kalenzo |
//|                                       http://www.foreksik.prv.pl |
//+------------------------------------------------------------------+
#property copyright "Kalenzo"
#property link      "http://www.foreksik.prv.pl"

#property indicator_color1 Magenta
#property indicator_color2 Yellow
#property indicator_chart_window
#property indicator_buffers 2

double sarUp[],sarDn[];//buffers
extern double Step = 0.01;
extern double Maximum = 0.2;
extern int Precision = 4;
extern bool SoundON=true;
bool TurnedUp = false;
bool TurnedDown = false;

//+------------------------------------------------------------------+
//| Custom indicator initialization function                         |
//+------------------------------------------------------------------+
int init()
  {
//---- indicators
   SetIndexStyle(0,DRAW_ARROW,STYLE_DOT,1,Magenta);
   SetIndexStyle(1,DRAW_ARROW,STYLE_DOT,1,Yellow);
   SetIndexBuffer(0,sarUp);
   SetIndexBuffer(1,sarDn);
   SetIndexArrow(0,108);
   SetIndexArrow(1,108);

   IndicatorShortName("SAR COLORED");
   SetIndexLabel(0,"SAR Up Channel");
   SetIndexLabel(1,"SAR Down Channel");

   SetIndexDrawBegin(0,2);
   SetIndexDrawBegin(1,2);
//----
   return(0);
  }
//+------------------------------------------------------------------+
//| Custor indicator deinitialization function                       |
//+------------------------------------------------------------------+
int deinit()
  {
//----

//----
   return(0);
  }
//+------------------------------------------------------------------+
//| Custom indicator iteration function                              |
//+------------------------------------------------------------------+
int start()
  {

   int limit;
   int counted_bars=IndicatorCounted();
   if(counted_bars<0) counted_bars=0;
   if(counted_bars>0) counted_bars--;
   limit=Bars-counted_bars;
//----
  for(int i = 0; i<limit ;i++)
   {
      double sar = NormalizeDouble(iSAR(Symbol(),0,Step,Maximum,i),Precision);
          if(sar >= iHigh(Symbol(),0,i))
      {
       if(SoundON==true && !TurnedUp && sarUp[i] == 0)
        {
        Alert("Sar Channel Going Down on ",Symbol(),"-",Period());
                  TurnedUp = true;
            TurnedDown = false;
       }
         sarUp[i] = sar;
         sarDn[i] = 0;
      }
    else
      {
       if(SoundON==true && !TurnedDown && sarDn[i] == 0)
        {
        Alert("Sar Channel Going Up on ",Symbol(),"-",Period());
                    TurnedDown = true;
            TurnedUp = false;
        }
         sarUp[i] = 0;
         sarDn[i] = sar;
       }
   }
 //----
   return(0);
  }
//+------------------------------------------------------------------+
Comments