Parabolic_standart2
Download script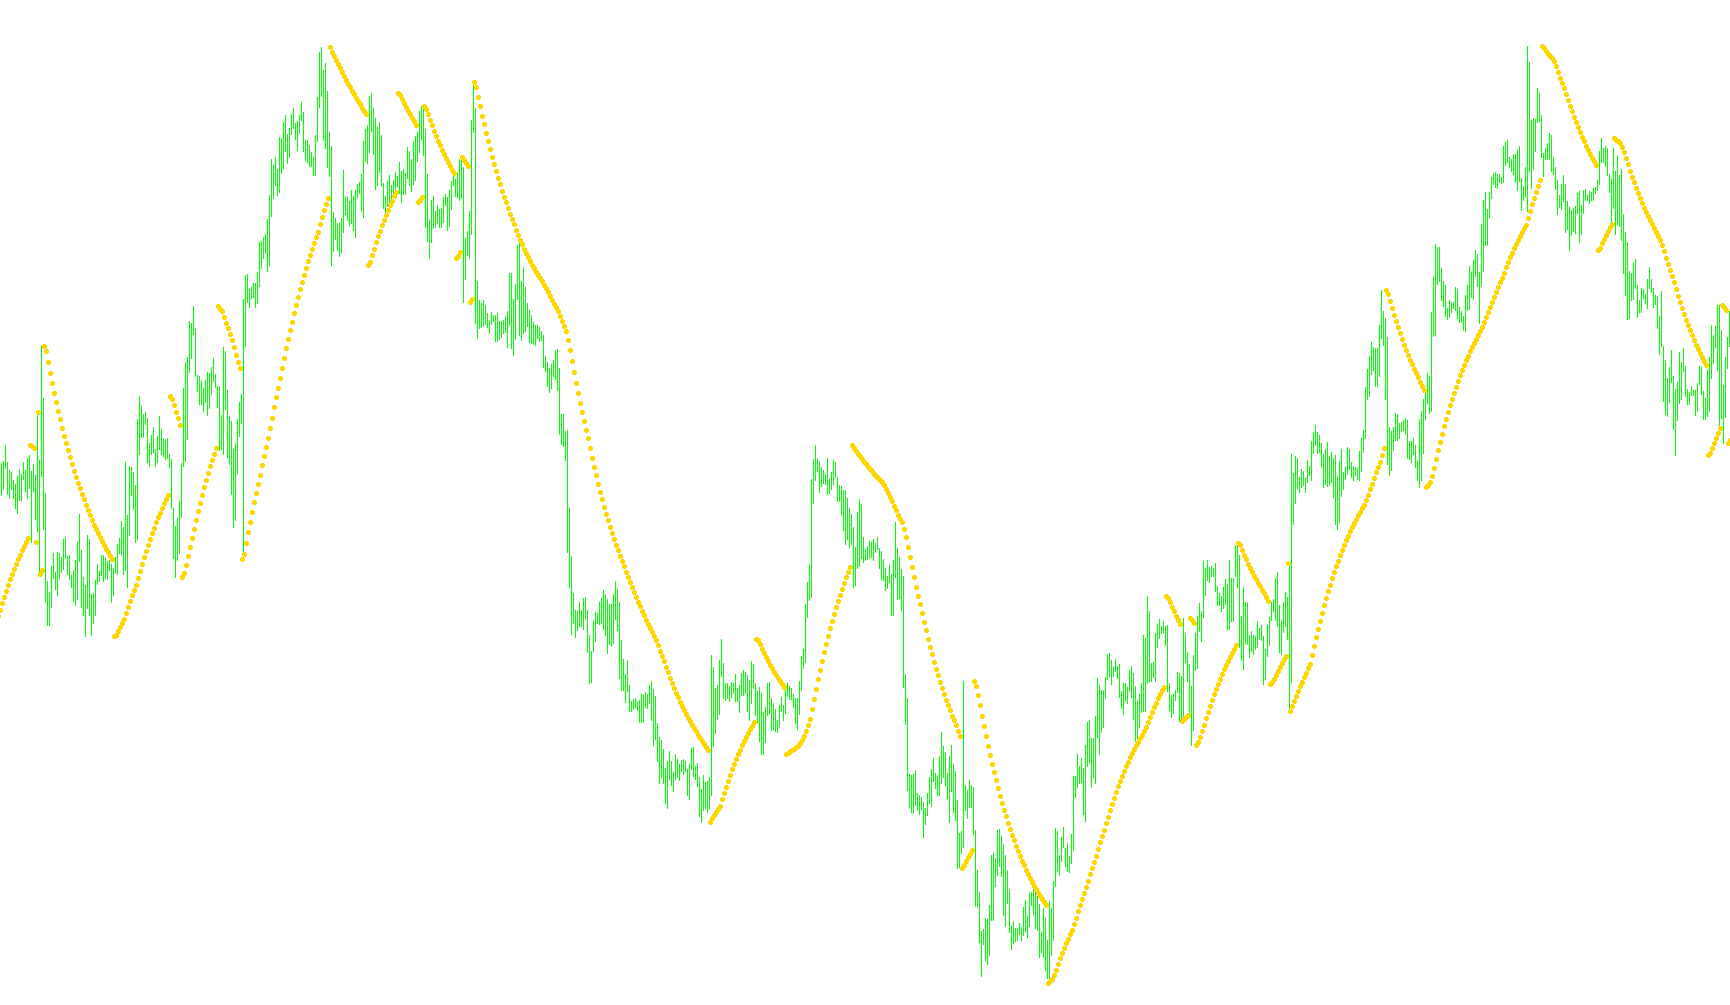
This script is designed as a technical analysis tool for the MetaTrader platform, specifically creating a dynamic visual indicator that tracks price movement and potential trend reversals. It functions by identifying the direction of market momentum and plotting specific "Sar" (Stop and Reverse) values on your chart.
Core Logic and Movement
The tool operates by calculating a moving trajectory based on two primary variables: a "Step" (the speed of calculation) and a "Maximum" limit (the ceiling for the acceleration). Instead of following the price exactly, it creates a trailing line that reacts to market highs and lows.
Trend Detection (Long vs. Short)
The logic switches between two distinct states:
- Upward Momentum: When the market is trending up, the indicator tracks recent price peaks. It monitors whether the current price is pushing higher or if it is beginning to pull back.
- Downward Momentum: When the market is trending down, the indicator shifts its focus to recent price troughs, monitoring for continued drops or potential rebounds.
The "Reverse" Mechanism
The primary goal of this script is to signal when a trend has exhausted itself and is likely to flip direction. It does this through a specific set of conditions:
- Acceleration: As the price moves in a sustained direction, the indicator gradually increases its calculation speed (up to the predefined maximum). This makes the indicator more sensitive as a trend matures.
- Triggering a Flip: The script constantly compares the calculated trajectory against the current market lows (in an uptrend) or highs (in a downtrend).
- Re-entry: If the price crosses this calculated trajectory, the script recognizes a "reversal." It immediately resets its speed, switches its tracking direction (e.g., from looking for new highs to looking for new lows), and plots a new point on the chart.
Visual Output
For the user, this logic manifests as an indicator that moves across the price candles. By observing where these points appear, traders can visually identify areas where a trend may be losing steam or where a significant shift in market sentiment has occurred, allowing for better-informed decisions on when to enter or exit a position.
//+------------------------------------------------------------------+
//|                                           Parabolic_standart.mq4 |
//|                      Copyright © 2008, MetaQuotes Software Corp. |
//|                      Copyright © 2008, Ëóêàøóê Â.Ã. aka lukas1.  |
//+------------------------------------------------------------------+
#property copyright "Copyright © 2008, MetaQuotes + lukas1"

#property indicator_chart_window
#property indicator_color1 Orchid
//---- input parameters
extern double    Step=0.02;
extern double    Maximum=0.04;
//---- buffers
double SarBuffer[];
//----
static bool first=false;
bool   dirlong;
double start,last_high,last_low;
double ep,sar,price_low,price_high;
//+------------------------------------------------------------------+
//| Custom indicator initialization function                         |
//+------------------------------------------------------------------+
int init()
  {
//---- indicators
   IndicatorDigits(Digits);
   string SS=DoubleToStr(Step,4);
   string MM=DoubleToStr(Maximum,4);
   SetIndexLabel(0,"Step= "+SS+", Max= "+MM);
   SetIndexStyle(0,DRAW_ARROW);
   SetIndexArrow(0,159);
   SetIndexBuffer(0,SarBuffer);
   SetIndexDrawBegin(0, 4/Step);
//----
   return(0);
  }
//+------------------------------------------------------------------+
//| Parabolic Sell And Reverse system                                |
//+------------------------------------------------------------------+
int start()
  {
   if(Bars<5) return(0);
   dirlong=true;
   start=Step;
//--------------------------------------------+
   int i=Bars-4;
   while(i>=0)
     {
      price_low=Low[i];
      price_high=High[i];
      //sar ðàâåí öåíà ïðåäûäóùåãî áàðà ïëþñ øàã óìíîæèòü íà
      //(ñòàðàÿ öåíà ìèíóñ çíà÷åíèå SarBuffer ïðåäûäóùåãî áàðà)
      sar=SarBuffer[i+1]+start*(ep-SarBuffer[i+1]);
//----
      if(dirlong)//öåïî÷êà ââåðõ
        {
         if(ep<price_high && (start+Step)<=Maximum) start+=Step;
         if(sar>=price_low)//åñëè óñëîâèÿ äëÿ ïåðåêëþ÷åíèÿ íàñòóïèëè
           {
            start=Step;
            dirlong=false;
            ep=price_low;//óñòàíàâëèâàåì ïîñëåäíþþ öåíó = ìèíèìóì
            last_low=price_low;
            if(High[i]<last_high) SarBuffer[i]=last_high;
            else SarBuffer[i]=High[i];
            i--;
            continue;
           }
         else
           {
            if(ep<price_low && (start+Step)<=Maximum) start+=Step;
            //è ïåðåñ÷èòûâàåì last_high è ep äëÿ ðàñ÷åòà ñëåäóþùåé òî÷êè ìàêñèìóìà
            if(ep<price_high) { last_high=price_high; ep=price_high; }
           }
        }
//----
      else//öåïî÷êà âíèç
        {
         if(ep>price_low && (start+Step)<=Maximum) start+=Step;
         if(sar<=price_high)//åñëè íàñòóïèëè óñëîâèÿ ïåðåêëþ÷åíèÿ
           {
            start=Step;
            dirlong=true;
            ep=price_high;//óñòàíàâëèâàåì ïîñëåäíþþ öåíó = ìàêñèìóì
            last_high=price_high;
            if(Low[i]>last_low) SarBuffer[i]=last_low;
            else SarBuffer[i]=Low[i];
            i--;
            continue;
           }
         else
           {
            if(ep>price_high && (start+Step)<=Maximum) start+=Step;
            //åñëè óñëîâèÿ äëÿ ïåðåêëþ÷åíèÿ íå íàñòóïèëè
            //òî ïåðåñ÷èòûâàåì last_low è ep äëÿ ðàñ÷åòà ñëåäóþùåé òî÷êè ìèíèìóìà
            if(ep>price_low){last_low=price_low;ep=price_low;}
           }
        }
      SarBuffer[i]=sar;
      i--;
     }
//----
   return(0);
  }
//+------------------------------------------------------------------+
Comments