Price Channel_v3
Download script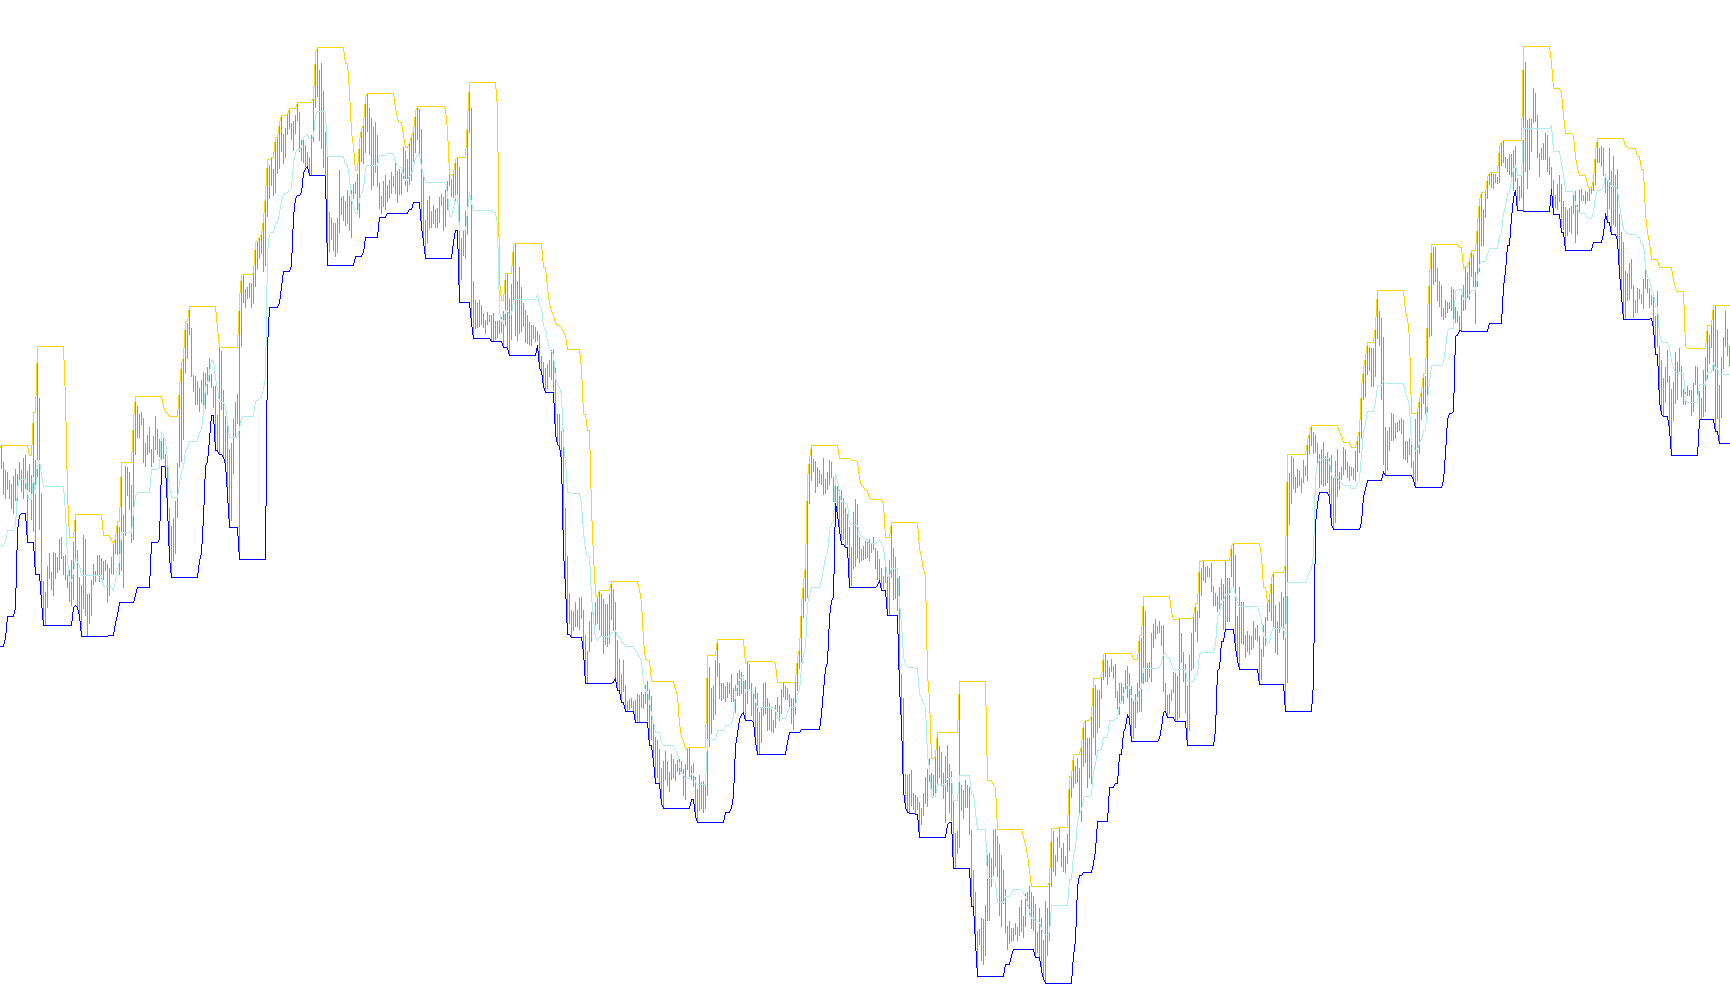
This tool is designed to provide traders with a visual representation of price boundaries and trends by identifying the historical extremes of market movement over a specific period. By analyzing these boundaries, it helps users understand the volatility and the "trading range" of an asset at any given moment.
Core Functionality
The indicator functions by looking back at a user-defined number of previous candles (the "Channel Period"). Instead of simply showing current prices, it scans this specific window of time to identify two critical data points:
- The Highest Peak: The maximum price reached during that period.
- The Lowest Valley: The minimum price dropped to during that same period.
Visual Components
The script renders three distinct lines on your chart to create a complete "Price Channel":
- Upper Boundary (Red Line): This line tracks the highest price achieved within the look-back period. It acts as a visual ceiling, showing where the market has reached its maximum reach recently.
- Lower Boundary (Blue Line): This line tracks the lowest price recorded within the period. It serves as a visual floor, identifying the support level or the deepest point the price has touched.
- Midline (DodgerBlue Line): This is the mathematical average of the upper and lower boundaries. By calculating the exact midpoint between the peak and the valley, it provides a central "equilibrium" line for the current price action.
How it Works for the Trader
As new candles form, the indicator constantly recalculates these three values based on your chosen period.
- If the price breaks above the Upper Boundary, it suggests a potential new high is being formed or a trend is accelerating.
- If the price drops below the Lower Boundary, it may indicate a breakdown in support.
- The Midline serves as a reference point to gauge whether the current price is trading in the upper half of its recent range (bullish sentiment) or the lower half (bearish sentiment).
In summary, this script simplifies complex price history into a clear, three-line channel that defines the immediate "territory" of the market, allowing you to see where the price has been and how far it can potentially move.
//+------------------------------------------------------------------+
//|                                                Price Channel.mq4 |
//|                                                                  |
//|                                       http://forex.kbpauk.ru/    |
//+------------------------------------------------------------------+

#property link      "http://forex.kbpauk.ru/"

#property indicator_chart_window
#property indicator_buffers 3
#property indicator_color1 Red
#property indicator_color2 Blue
#property indicator_color3 DodgerBlue
//---- input parameters
extern int ChannelPeriod = 14;
//---- buffers
double UpBuffer[];
double DnBuffer[];
double MdBuffer[];
//+------------------------------------------------------------------+
//| Custom indicator initialization function                         |
//+------------------------------------------------------------------+
int init()
  {
   string short_name;
//---- indicator line
   SetIndexStyle(0, DRAW_LINE);
   SetIndexStyle(1, DRAW_LINE);
   SetIndexStyle(2, DRAW_LINE);
   SetIndexBuffer(0, UpBuffer);
   SetIndexBuffer(1, DnBuffer);
   SetIndexBuffer(2, MdBuffer);
//---- name for DataWindow and indicator subwindow label
   short_name="Price Channel("+ChannelPeriod+")";
   IndicatorShortName(short_name);
   SetIndexLabel(0, "UpCh");
   SetIndexLabel(1, "DownCh");
   SetIndexLabel(2, "MidCh");
//----
   SetIndexDrawBegin(0, ChannelPeriod);
   SetIndexDrawBegin(1, ChannelPeriod);
   SetIndexDrawBegin(2, ChannelPeriod);
//----
   return(0);
  }
//+------------------------------------------------------------------+
//| Price Channel                                                         |
//+------------------------------------------------------------------+
int start()
  {
   int i, counted_bars = IndicatorCounted();
   int    k;
   double high, low, price;
//----
   if(Bars <= ChannelPeriod)
       return(0);
//---- initial zero
   if(counted_bars < 1)
      for(i = 1;i <= ChannelPeriod; i++)
          UpBuffer[Bars-i] = 0.0;
//----
   i = Bars - ChannelPeriod - 1;
   if(counted_bars >= ChannelPeriod)
       i = Bars - counted_bars - 1;
   while(i >= 0)
     {
       high = High[i];
       low = Low[i];
       k = i - 1 + ChannelPeriod;
       while(k >= i)
         {
           price = High[k];
           if(high < price)
               high = price;
           price = Low[k];
           if(low > price)
               low = price;
           k--;
         }
       UpBuffer[i] = high;
       DnBuffer[i] = low;
       MdBuffer[i] = (high + low) / 2;
       i--;
     }
   return(0);
  }
//+------------------------------------------------------------------+
Comments