PriceChannel_Stop_v1_v2
Download script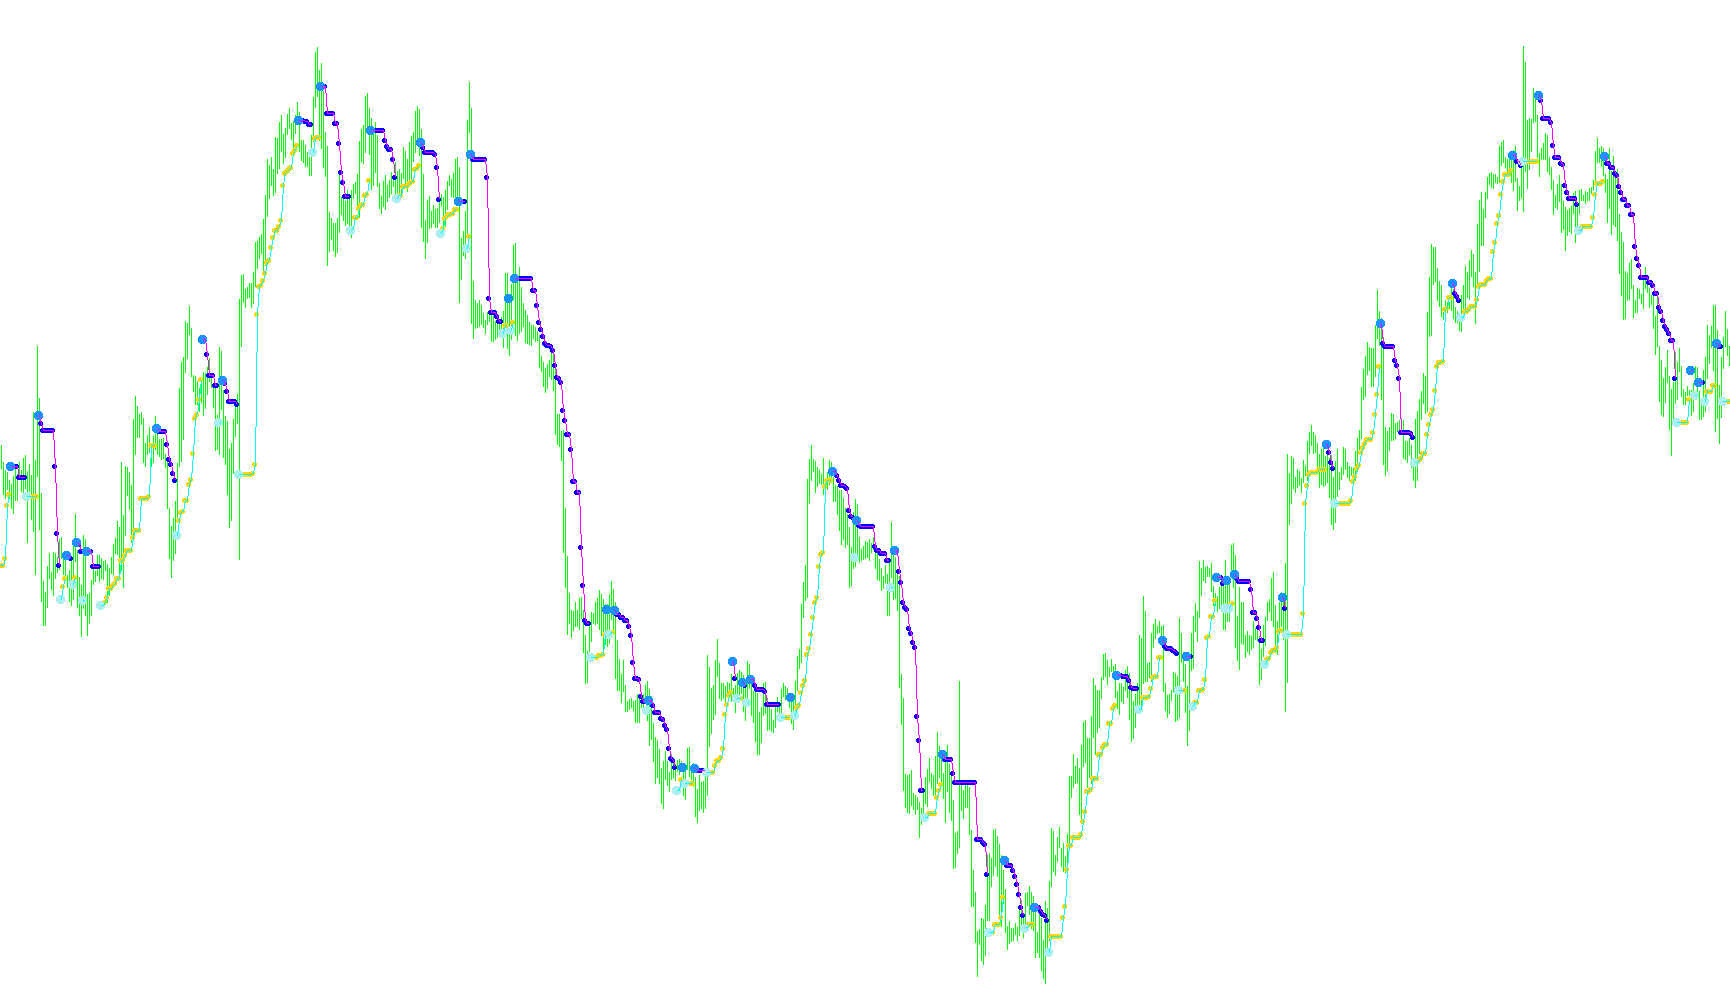
This technical indicator is designed to help traders identify and visualize market trends by establishing dynamic price "channels" or boundaries. Instead of just showing a simple moving average, it calculates the volatility of the market over a specific period to determine where the price is likely to hold its ground.
How the Logic Works
1. Identifying Volatility Zones The script first looks at a set number of previous candles (defined by the "ChannelPeriod") to find the highest high and the lowest low within that timeframe. Based on these extremes, it calculates a specific range. It then applies a "Risk" percentage to these extremes to create upper and lower boundaries. Think of this as creating a "safety zone" around the current price movement.
2. Trend Detection The tool determines the direction of the market by comparing where the current price closes relative to the previous boundaries:
- Upward Trend: If the price closes above the upper boundary, the script identifies an upward bias.
- Downward Trend: If the price closes below the lower boundary, it identifies a downward bias.
3. Dynamic Boundary Adjustment To ensure the trend lines stay relevant, the logic includes a "ratchet" effect. During an uptrend, the bottom boundary will only move up; it will never drop. Conversely, during a downtrend, the top boundary will only move down; it will never rise. This prevents the indicator from "resetting" too easily and helps maintain a clear visual of the prevailing trend.
4. Visual Signals and Lines The script translates these mathematical calculations into three distinct visual elements on your chart:
- Trend Lines: These provide a continuous visual path showing the current support (in an uptrend) or resistance (in a downtrend).
- Stop/Signal Markers: The indicator places specific markers (arrows or points) when a trend is confirmed or shifts. This helps distinguish between "active" trend movements and new signal entries.
- Trend Filtering: By adjusting the "Signal" and "Line" parameters, you can choose whether you want to see only the primary trend lines, the specific entry signals, or both simultaneously.
Summary for the Trader
In simple terms, this script acts as a dynamic floor and ceiling for the market price. It automatically adjusts based on how much the market is swinging (volatility). When the price breaks out of these boundaries, the indicator switches its focus to the new direction, providing you with a clear visual of where the "line in the sand" is currently being drawn by the market.
/*-----------------------------+
|			       |
| Shared by www.Aptrafx.com    |
|			       |
+------------------------------*/

//+------------------------------------------------------------------+
//|                                         PriceChannel_Stop_v1.mq4 |
//+------------------------------------------------------------------+

#property indicator_chart_window
#property indicator_buffers 6
#property indicator_color1 Aqua
#property indicator_width1 1
#property indicator_color2 Magenta
#property indicator_width2 1
#property indicator_color3 Aqua
#property indicator_width3 3
#property indicator_color4 Magenta
#property indicator_width4 3
#property indicator_color5 Aqua
#property indicator_color6 Magenta
//---- input parameters
extern int ChannelPeriod=9;
extern double Risk=0.30;
extern int Signal=1;
extern int Line=1;
extern int Nbars=20000;
//---- indicator buffers
double UpTrendBuffer[];
double DownTrendBuffer[];
double UpTrendSignal[];
double DownTrendSignal[];
double UpTrendLine[];
double DownTrendLine[];
//+------------------------------------------------------------------+
//| Custom indicator initialization function                         |
//+------------------------------------------------------------------+
int init()
  {
   string short_name;
//---- indicator line
   SetIndexBuffer(0,UpTrendBuffer);
   SetIndexBuffer(1,DownTrendBuffer);
   SetIndexBuffer(2,UpTrendSignal);
   SetIndexBuffer(3,DownTrendSignal);
   SetIndexBuffer(4,UpTrendLine);
   SetIndexBuffer(5,DownTrendLine);
   SetIndexStyle(0,DRAW_ARROW);
   SetIndexStyle(1,DRAW_ARROW);
   SetIndexStyle(2,DRAW_ARROW);
   SetIndexStyle(3,DRAW_ARROW);
   SetIndexStyle(4,DRAW_LINE);
   SetIndexStyle(5,DRAW_LINE);
   SetIndexArrow(0,159);
   SetIndexArrow(1,159);
   SetIndexArrow(2,108);
   SetIndexArrow(3,108);
//---- name for DataWindow and indicator subwindow label
   short_name="PriceChannel_Stop_v1("+ChannelPeriod+")";
   IndicatorShortName(short_name);
   SetIndexLabel(0,"UpTrend Stop");
   SetIndexLabel(1,"DownTrend Stop");
   SetIndexLabel(2,"UpTrend Signal");
   SetIndexLabel(3,"DownTrend Signal");
   SetIndexLabel(4,"UpTrend Line");
   SetIndexLabel(5,"DownTrend Line");
//----
   SetIndexDrawBegin(0,ChannelPeriod);
   SetIndexDrawBegin(1,ChannelPeriod);
   SetIndexDrawBegin(2,ChannelPeriod);
   SetIndexDrawBegin(3,ChannelPeriod);
   SetIndexDrawBegin(4,ChannelPeriod);
   SetIndexDrawBegin(5,ChannelPeriod);
//----
   return(0);
  }
//+------------------------------------------------------------------+
//| PriceChannel_Stop_v1                                             |
//+------------------------------------------------------------------+
int start()
  {
   int    i,shift,trend;
   double high, low, price;
   double smax[20000],smin[20000],bsmax[20000],bsmin[20000];

   for (shift=Nbars-1;shift>=0;shift--)
   {
   UpTrendBuffer[shift]=EMPTY_VALUE;
   DownTrendBuffer[shift]=EMPTY_VALUE;
   UpTrendSignal[shift]=EMPTY_VALUE;
   DownTrendSignal[shift]=EMPTY_VALUE;
   UpTrendLine[shift]=EMPTY_VALUE;
   DownTrendLine[shift]=EMPTY_VALUE;
   }
   for (shift=Nbars-ChannelPeriod-1;shift>=0;shift--)
   {
      high=High[shift]; low=Low[shift]; i=shift-1+ChannelPeriod;
      while(i>=shift)
        {
         price=High[i];
         if(high<price) high=price;
         price=Low[i];
         if(low>price)  low=price;
         i--;
        }
     smax[shift]=high;
     smin[shift]=low;

     bsmax[shift]=smax[shift]-(smax[shift]-smin[shift])*Risk;
	  bsmin[shift]=smin[shift]+(smax[shift]-smin[shift])*Risk;

     if (Close[shift]>bsmax[shift+1])  trend=1;
	  if (Close[shift]<bsmin[shift+1])  trend=-1;

	  if(trend>0 && bsmin[shift]<bsmin[shift+1]) bsmin[shift]=bsmin[shift+1];
	  if(trend<0 && bsmax[shift]>bsmax[shift+1]) bsmax[shift]=bsmax[shift+1];

	  if (trend>0)
	  {
	     if (Signal>0 && UpTrendBuffer[shift+1]==-1.0)
	     {
	     UpTrendSignal[shift]=bsmin[shift];
	     if(Line>0) UpTrendLine[shift]=bsmin[shift];
	     }
	     else
	     {
	     UpTrendBuffer[shift]=bsmin[shift];
	     if(Line>0) UpTrendLine[shift]=bsmin[shift];
	     UpTrendSignal[shift]=-1;
	     }
	  if (Signal==2) UpTrendBuffer[shift]=0;
	  DownTrendBuffer[shift]=-1.0;
	  DownTrendLine[shift]=EMPTY_VALUE;
	  }
	  if (trend<0)
	  {
	  if (Signal>0 && DownTrendBuffer[shift+1]==-1.0)
	     {
	     DownTrendSignal[shift]=bsmax[shift];
	     if(Line>0) DownTrendLine[shift]=bsmax[shift];
	     }
	     else
	     {
	     DownTrendBuffer[shift]=bsmax[shift];
	     if(Line>0)DownTrendLine[shift]=bsmax[shift];
	     DownTrendSignal[shift]=-1;
	     }
	  if (Signal==2) DownTrendBuffer[shift]=0;
	  UpTrendBuffer[shift]=-1.0;
	  UpTrendLine[shift]=EMPTY_VALUE;
	  }


   }
   return(0);
  }
//+------------------------------------------------------------------+
Comments