PriceTrender2_v1
Download script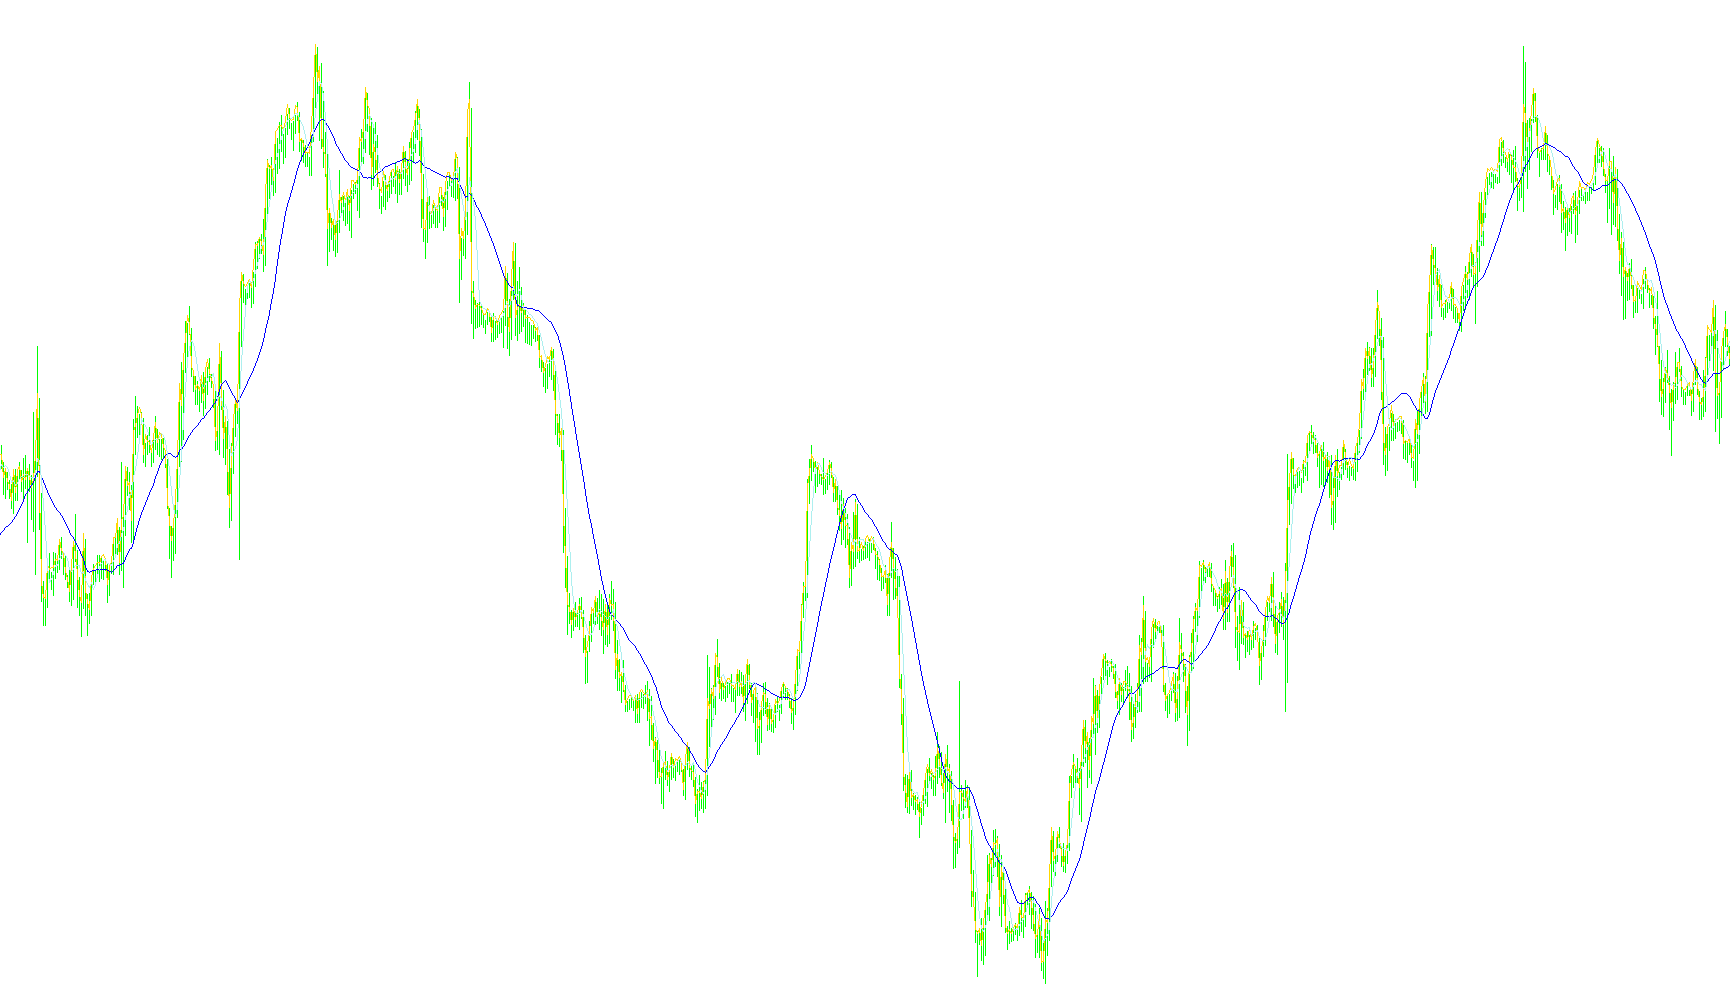
The PriceTrender2 indicator is designed to provide traders with a multi-layered visual representation of market movement by analyzing price data across different time horizons. Instead of simply looking at the current price, this tool organizes market information into three distinct visual components to help identify trends and momentum more clearly.
Core Functionality
The logic operates by synthesizing three specific data streams:
1. Primary Price Reference The tool first identifies a foundational "Price" point. Users can customize exactly which part of the market candle they want to track—whether it be the closing price, the opening price, the highs, the lows, or various mathematical averages (such as the midpoint or a weighted average of the entire candle). This allows for a highly personalized view of where the "true" price sits based on your trading style.
2. Dual Moving Average Analysis To provide context to the price, the script calculates two separate moving averages simultaneously.
- The Primary Trend: A longer-term average (defaulted to 24 periods) helps smooth out minor market "noise" to reveal the broader direction of the trend.
- The Secondary Trend: A shorter-term average (defaulted to 5 periods) reacts more quickly to immediate price fluctuations.
How the Logic Works Together
The script uses a sophisticated synchronization method called "Big Shift." This means that regardless of what timeframe you are currently viewing on your chart, the indicator reaches back into the specified primary timeframe to pull data. It ensures that the trend lines and price points remain consistent and accurate relative to the historical data they are based on.
By plotting these three elements—the custom price point, the long-term trend, and the short-term trend—on a separate window, the tool allows you to visualize:
- Trend Alignment: When both averages move in the same direction.
- Momentum Shifts: When the short-term trend begins to diverge from the long-term trend.
- Price Positioning: Where the current market price sits in relation to those moving averages.
In essence, this script acts as a visual filter, distilling complex market fluctuations into three clean lines that represent price action, broader momentum, and immediate sentiment.
/*-----------------------------+
|			       |
| Shared by www.Aptrafx.com    |
|			       |
+------------------------------*/

//+------------------------------------------------------------------+
//|                                                PriceTrender2.mq4 |
//|                                                          Kalenzo |
//|                                      bartlomiej.gorski@gmail.com |
//+------------------------------------------------------------------+
#property copyright "Kalenzo"
#property link      "bartlomiej.gorski@gmail.com"
#property indicator_buffers 3
#property indicator_color1 DodgerBlue
#property indicator_color2 Gold
#property indicator_color3 Lime

extern int TimeFrame = 60,
           Price = 0,
           Ma1Type = 0,
           Ma1Price = 0,
           Ma1Length = 24,
           Ma2Type = 0,
           Ma2Price = 0,
           Ma2Length = 5;


double price[],trend[],trend2[];

#property indicator_separate_window
//+------------------------------------------------------------------+
//| Custom indicator initialization function                         |
//+------------------------------------------------------------------+
int init()
  {
//---- indicators
SetIndexBuffer(0,price);
SetIndexBuffer(1,trend);
SetIndexBuffer(2,trend2);

SetIndexStyle(0,DRAW_LINE,STYLE_SOLID,1);
SetIndexStyle(1,DRAW_LINE,STYLE_SOLID,1);
SetIndexStyle(2,DRAW_LINE,STYLE_SOLID,1);

//----
   return(0);
  }
//+------------------------------------------------------------------+
//| Custom indicator deinitialization function                       |
//+------------------------------------------------------------------+
int deinit()
  {
//----

//----
   return(0);
  }
//+------------------------------------------------------------------+
//| Custom indicator iteration function                              |
//+------------------------------------------------------------------+
int start()
  {
   int    limit, bigshift;
   int    counted_bars=IndicatorCounted();
//----
   if (counted_bars<0) return(-1);
   if (counted_bars>0) counted_bars--;
   limit=Bars-counted_bars;

   for (int i=limit; i>=0; i--)
   {
      bigshift = iBarShift(Symbol(),TimeFrame,Time[i]);

       price[i] = getPrice(bigshift);
       trend[i] = iMA(Symbol(),TimeFrame,Ma1Length,0,Ma1Type,Ma1Price,bigshift);
       trend2[i] = iMA(Symbol(),TimeFrame,Ma2Length,0,Ma2Type,Ma2Price,bigshift);
   }

//----

   return(0);
  }
//+------------------------------------------------------------------+
double getPrice(int shift)
{
   switch(Price)
   {
      case 0 : return ( iClose(Symbol(),TimeFrame,shift) );
      case 1 : return (iOpen(Symbol(),TimeFrame,shift));
      case 2 : return (iHigh(Symbol(),TimeFrame,shift));
      case 3 : return (iLow(Symbol(),TimeFrame,shift));
      case 4 : return ((iLow(Symbol(),TimeFrame,shift)+iHigh(Symbol(),TimeFrame,shift))/2);
      case 5 : return ((iClose(Symbol(),TimeFrame,shift)+iLow(Symbol(),TimeFrame,shift)+iHigh(Symbol(),TimeFrame,shift))/3);
      case 6 : return ((iOpen(Symbol(),TimeFrame,shift)+iClose(Symbol(),TimeFrame,shift)+iLow(Symbol(),TimeFrame,shift)+iHigh(Symbol(),TimeFrame,shift))/4);
   }
}
Comments