Overview
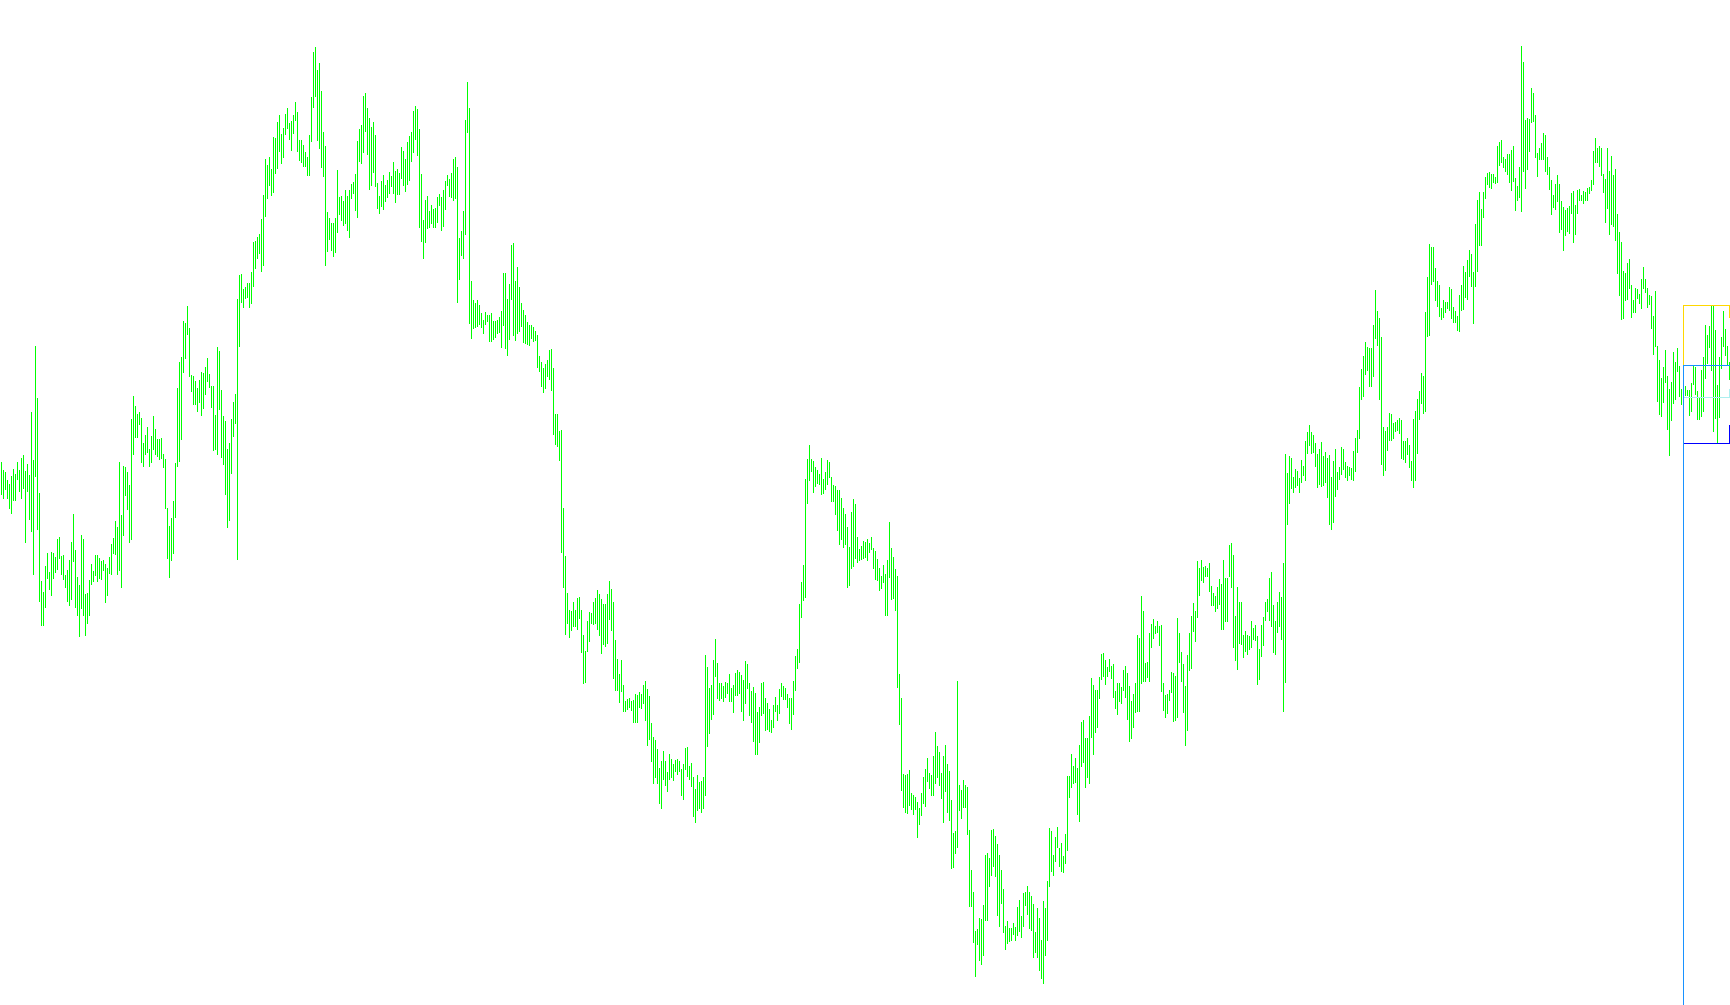
This tool is designed to provide traders with a clear visual representation of price action from higher timeframes directly on their current trading chart. By simplifying how data from different periods (such as Daily, Weekly, or Hourly charts) is displayed, it helps traders identify broader market trends and significant price boundaries without needing to switch back and forth between different tabs.
How It Works
The core logic of this script focuses on "Timeframe Alignment." Here is a breakdown of how the tool processes information:
1. Multi-Timeframe Data Retrieval The script allows you to choose a specific higher timeframe (for example, if you are currently looking at a 15-minute chart, you can choose to view Daily data). It automatically reaches out to collect four specific pieces of information from that chosen period: the High price, the Low price, the Opening price, and the Closing price.
2. Visual Mapping and Alignment One of the most important features of this script is how it aligns these prices with your current view. Because a single "Day" or "Hour" on a high timeframe contains many smaller candles on your current chart, the script calculates the exact position where those higher timeframe boundaries occur. It then "stretches" or shifts these values so they sit perfectly in line with the correct time periods on your screen.
3. Visual Indicators The script draws four distinct lines on your chart to represent this data:
- High & Low Boundaries: These show you the extreme price points reached during the higher timeframe period, helping you identify "zones" of support and resistance.
- Open & Close Points: These highlight where the period started and ended, providing a quick snapshot of the price movement (upward or downward) over that larger duration.
4. Safety Logic The script includes built-in checks to ensure data integrity. It ensures that you are viewing a higher timeframe than the one currently active on your screen. If you attempt to load a timeframe that is smaller than your current chart, the tool will provide an alert, as it requires the "larger" data to be mapped onto the "smaller" view.
Summary for the Trader
Instead of manually calculating where a daily candle opens or closes while looking at a 5-minute chart, this script does the heavy lifting for you. It overlays the boundaries of your chosen timeframe as steady lines, allowing you to see the "big picture" while making precise entries on smaller movements.
//+------------------------------------------------------------------+
//|                                                     Range_v2.mq4 |
//|                                  Copyright © 2006, Forex-TSD.com |
//|                         Written by IgorAD,igorad2003@yahoo.co.uk |
//|            http://finance.groups.yahoo.com/group/TrendLaboratory |
//+------------------------------------------------------------------+
//mod lables+small staff
#property copyright "Copyright © 2006, Forex-TSD.com "
#property link      "http://www.forex-tsd.com/"

#property indicator_chart_window
#property indicator_buffers 4
#property indicator_color1 DodgerBlue
#property indicator_color2 Tomato
#property indicator_color3 Orange
#property indicator_color4 Lime

#property indicator_width1 1
#property indicator_width2 1
#property indicator_width3 2
#property indicator_width4 2
#property indicator_style1 2
#property indicator_style2 2

extern string  TimeFrame =  "D1";
extern int     Shift     =   0;
extern int     AjShift   =   0;
extern string TimeFrames = "1,5,15,30;H1(60);H4;D1;W1;MN";


double UpBuffer[];
double DnBuffer[];
double OpenBuffer[];
double CloseBuffer[];
int TF;
string error="Wrong TimeFrame!";


int init()
{
   string short_name;
   //IndicatorBuffers(4);

   SetIndexStyle(0,DRAW_LINE);
   SetIndexBuffer(0,UpBuffer);
   SetIndexDrawBegin(0,0);

   SetIndexStyle(1,DRAW_LINE);
   SetIndexBuffer(1,DnBuffer);
   SetIndexDrawBegin(1,0);

   SetIndexStyle(2,DRAW_LINE);
   SetIndexBuffer(2,OpenBuffer);
   SetIndexDrawBegin(2,0);

   SetIndexStyle(3,DRAW_LINE);
   SetIndexBuffer(3,CloseBuffer);
   SetIndexDrawBegin(3,0);


   if (TimeFrame=="M1"||TimeFrame=="m1"  ||TimeFrame=="1") TF=PERIOD_M1;
   else
   if (TimeFrame=="M5" ||TimeFrame=="m5" ||TimeFrame=="5") TF=PERIOD_M5;
   else
   if (TimeFrame=="M15"||TimeFrame=="m15"||TimeFrame=="15")TF=PERIOD_M15;
   else
   if (TimeFrame=="M30"||TimeFrame=="m30"||TimeFrame=="30")TF=PERIOD_M30;
   else
   if (TimeFrame=="H1" ||TimeFrame=="h1" ||TimeFrame=="60") TF=PERIOD_H1;
   else
   if (TimeFrame=="H4" ||TimeFrame=="h4" ||TimeFrame=="240") TF=PERIOD_H4;
   else
   if (TimeFrame=="D1" ||TimeFrame=="d1" ||TimeFrame=="1440") TF=PERIOD_D1;
   else
   if (TimeFrame=="W1" ||TimeFrame=="w1" ||TimeFrame=="10080") TF=PERIOD_W1;
   else
   if (TimeFrame=="MN" ||TimeFrame=="mn" ||TimeFrame=="43200") TF=PERIOD_MN1;
   else
   if (TimeFrame=="0") TF=Period();
   else {Comment(error); TF=Period(); return(0);}

   SetIndexShift(0,AjShift + Shift*TF/Period());
   SetIndexShift(1,AjShift + Shift*TF/Period());
   SetIndexShift(2,AjShift + Shift*TF/Period());
   SetIndexShift(3,AjShift + Shift*TF/Period());

   short_name="Range_v2.2 ["+TimeFrame+"]";
   IndicatorShortName(short_name);

   SetIndexLabel(0,"High "+TimeFrame);
   SetIndexLabel(1,"Low "+TimeFrame);
   SetIndexLabel(2,"Open "+TimeFrame);
   SetIndexLabel(3,"Close "+TimeFrame);


return(0);
}

int start()
{
   datetime TimeArray[];
   int i=0,y=0, prevy=0;
   int counted_bars=IndicatorCounted();
   double LowArray[],HighArray[],OpenArray[],CloseArray[];


      if (TF<Period())
      {
      SetIndexDrawBegin(0,Bars);
      SetIndexDrawBegin(1,Bars);
      Comment("Incorrect TimeFrame");
      return(0);
      }

   if ( counted_bars > 0 )  int limit=Bars-counted_bars+TF/Period();
   if ( counted_bars < 0 )  return(0);
   if ( counted_bars ==0 )  limit=Bars-1;

   ArrayCopySeries(TimeArray,MODE_TIME,Symbol(),TF);
   ArrayCopySeries(LowArray,MODE_LOW,Symbol(),TF);
   ArrayCopySeries(HighArray,MODE_HIGH,Symbol(),TF);
   ArrayCopySeries(OpenArray,MODE_OPEN,Symbol(),TF);
   ArrayCopySeries(CloseArray,MODE_CLOSE,Symbol(),TF);

      for(i=0,y=0;i<limit;i++)
      {
      prevy = y;
      if (Time[i]<TimeArray[y]) y++;
      UpBuffer[i]=HighArray[y];
      DnBuffer[i]=LowArray[y];
      OpenBuffer[i]=OpenArray[y];

      if(y!=prevy)
      CloseBuffer[i]=CloseArray[y];
      else CloseBuffer[i]=CloseArray[prevy];

      }
   return(0);
}
Comments