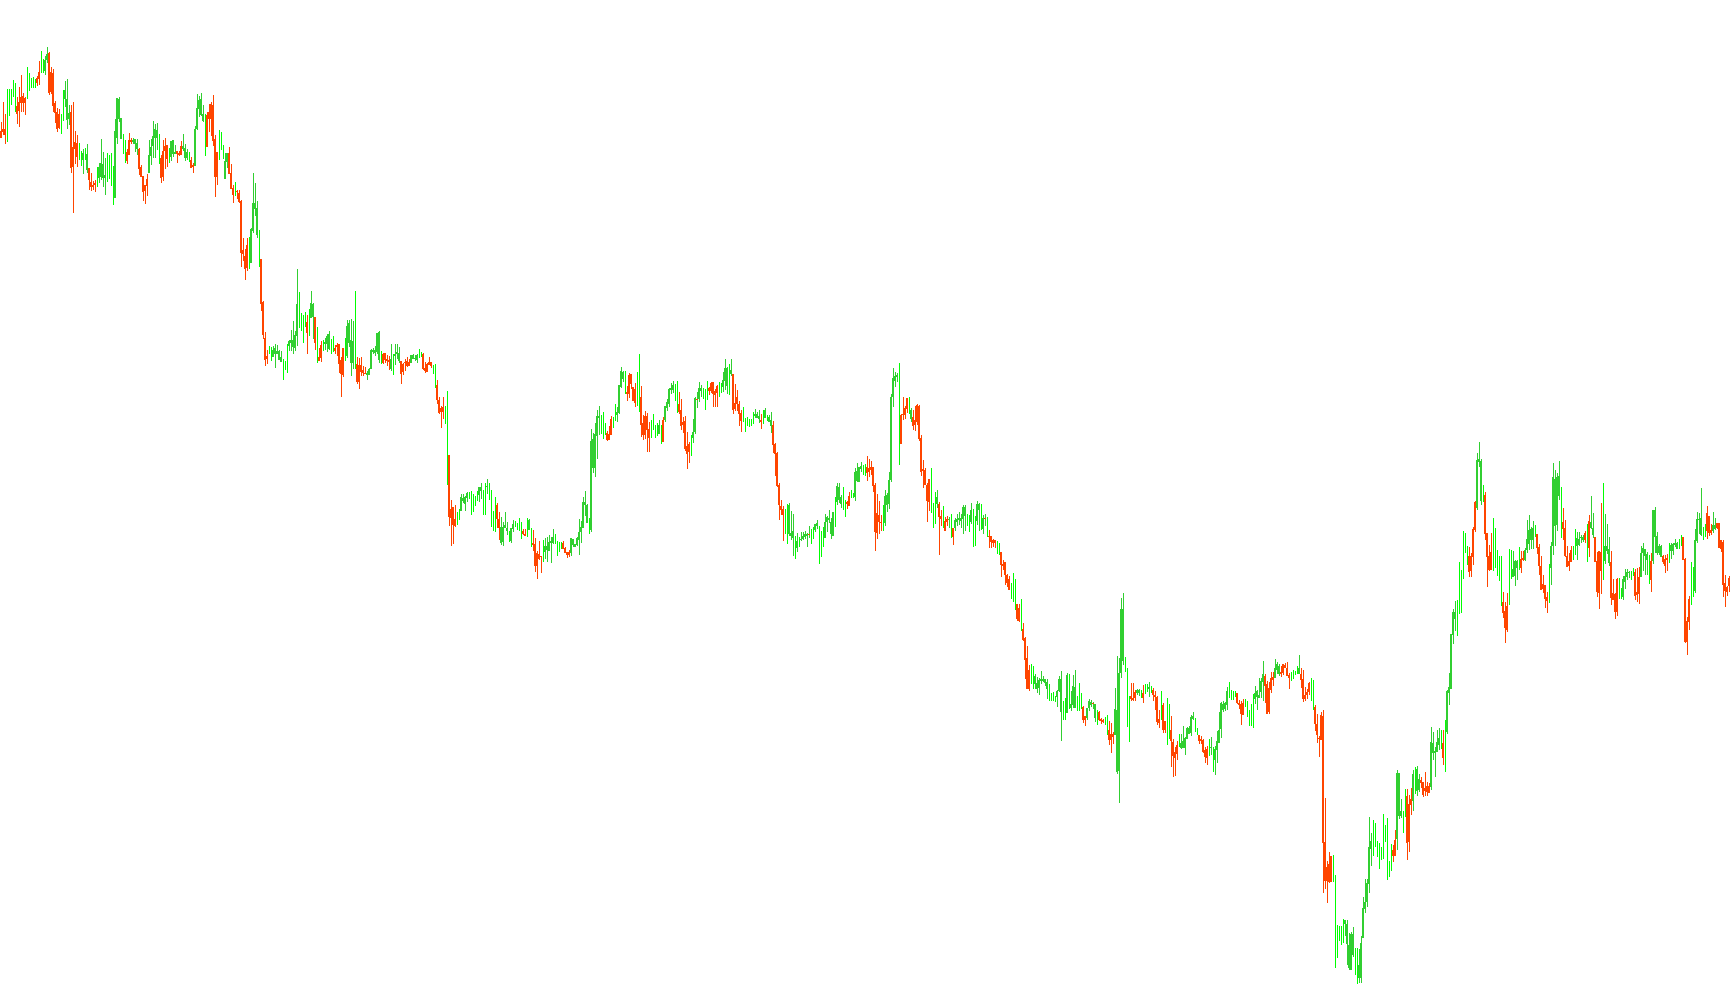
This technical indicator is designed to visually identify and highlight specific price action patterns based on the relationship between market momentum and candlestick behavior. By analyzing historical price data, the tool filters through market noise to pinpoint significant movements that align with two primary momentum components.
Core Logic Overview
The script operates by continuously scanning each candle on your chart to evaluate whether the current momentum is rising or falling. It specifically looks for "confluence," meaning it only triggers a visual signal when both the trend and the price action move in the same direction simultaneously.
How the Analysis Works
The logic follows a two-step verification process:
1. Momentum Verification The script monitors two underlying technical indicators (AO and AC). It checks if these values are currently increasing or decreasing compared to the previous candle.
- If both are rising, it identifies a potential upward move.
- If both are falling, it identifies a potential downward move.
2. Candlestick Correlation Once the momentum direction is established, the script looks at the "High," "Low," "Open," and "Close" prices of that specific candle to determine the strength of the move:
- Bullish Logic: When the momentum is rising, the tool captures the highest and lowest points of the candle to highlight the range of the upward push. It also identifies whether the price closed higher or lower than it opened to mark the core body of the movement.
- Bearish Logic: When the momentum is falling, the tool mirrors this behavior, capturing the high and low extremes while highlighting the specific price transition (the "body") of the downward move.
Visual Representation
The results are displayed directly on your chart as color-coded histograms:
- Green Markers: These signify areas where the market momentum and price action are aligned in an upward trajectory.
- Red Markers: These signify areas where the market momentum and price action are aligned in a downward trajectory.
By providing these visual cues, the script allows traders to quickly see where the trend is gaining strength or losing steam, effectively highlighting the "active" zones of the market while ignoring periods of stagnation or conflicting signals.
//+------------------------------------------------------------------+
//|                                                 Candlesticks.mq4 |
//|                                                         Vladimir |
//|                                         finance@allmotion.com.ua |
//+------------------------------------------------------------------+
// Ðàñêðàñêà ñâå÷åé ïî Âèëüÿìñó
#property copyright "Vladimir"
#property link      "finance@allmotion.com.ua"

#property indicator_chart_window
#property indicator_buffers 4
#property indicator_color1 LimeGreen
#property indicator_color2 OrangeRed
#property indicator_color3 LimeGreen
#property indicator_color4 OrangeRed
//---- buffers
double ExtMapBuffer1[];
double ExtMapBuffer2[];
double ExtMapBuffer3[];
double ExtMapBuffer4[];
//----
int ExtCountedBars=0;

//+------------------------------------------------------------------+
//| Custom indicator initialization function                         |
//+------------------------------------------------------------------+
int init()
  {
//---- indicators
   SetIndexStyle(0,DRAW_HISTOGRAM,0,1,LimeGreen);
   SetIndexBuffer(0,ExtMapBuffer1);
   SetIndexStyle(1,DRAW_HISTOGRAM,0,1,OrangeRed);
   SetIndexBuffer(1,ExtMapBuffer2);
   SetIndexStyle(2,DRAW_HISTOGRAM,0,3,LimeGreen);
   SetIndexBuffer(2,ExtMapBuffer3);
   SetIndexStyle(3,DRAW_HISTOGRAM,0,3,OrangeRed);
   SetIndexBuffer(3,ExtMapBuffer4);
//----
   SetIndexDrawBegin(0,10);
   SetIndexDrawBegin(1,10);
   SetIndexDrawBegin(2,10);
   SetIndexDrawBegin(3,10);
//---- indicator buffers mapping
   SetIndexBuffer(0,ExtMapBuffer1);
   SetIndexBuffer(1,ExtMapBuffer2);
   SetIndexBuffer(2,ExtMapBuffer3);
   SetIndexBuffer(3,ExtMapBuffer4);
//---- initialization done
   return(0);
  }
//+------------------------------------------------------------------+
//| Custor indicator deinitialization function                       |
//+------------------------------------------------------------------+
int deinit()
  {
//---- TODO: add your code here

//----
   return(0);
  }
//+------------------------------------------------------------------+
//| Custom indicator iteration function                              |
//+------------------------------------------------------------------+
int start()
  {
   if(Bars<=10) return(0);
   ExtCountedBars=IndicatorCounted();
//---- check for possible errors
   if (ExtCountedBars<0) return(-1);
//---- last counted bar will be recounted
   if (ExtCountedBars>0) ExtCountedBars--;
   int pos=Bars-ExtCountedBars-1;

   while(pos>=0)
     {

   	if (iAO(NULL,0,pos)>iAO(NULL,0,pos+1) && iAC(NULL,0,pos)>iAC(NULL,0,pos+1))
   	  	{
         ExtMapBuffer1[pos]=High[pos];
         ExtMapBuffer2[pos]=Low[pos];
         if (Open[pos]>=Close[pos]) { ExtMapBuffer3[pos]=Open[pos]; ExtMapBuffer4[pos]=Close[pos]; }
         if (Open[pos]<=Close[pos]) { ExtMapBuffer3[pos]=Close[pos]; ExtMapBuffer4[pos]=Open[pos]; }
         }
   	if (iAO(NULL,0,pos)<iAO(NULL,0,pos+1) && iAC(NULL,0,pos)<iAC(NULL,0,pos+1))
	     	{
         ExtMapBuffer1[pos]=Low[pos];
         ExtMapBuffer2[pos]=High[pos];
         if (Open[pos]<=Close[pos]) { ExtMapBuffer3[pos]=Open[pos]; ExtMapBuffer4[pos]=Close[pos]; }
         if (Open[pos]>=Close[pos]) { ExtMapBuffer3[pos]=Close[pos]; ExtMapBuffer4[pos]=Open[pos]; }
	  	   }
 	   pos--;
     }

   return(0);
  }
Comments