RAVI_v1
Download script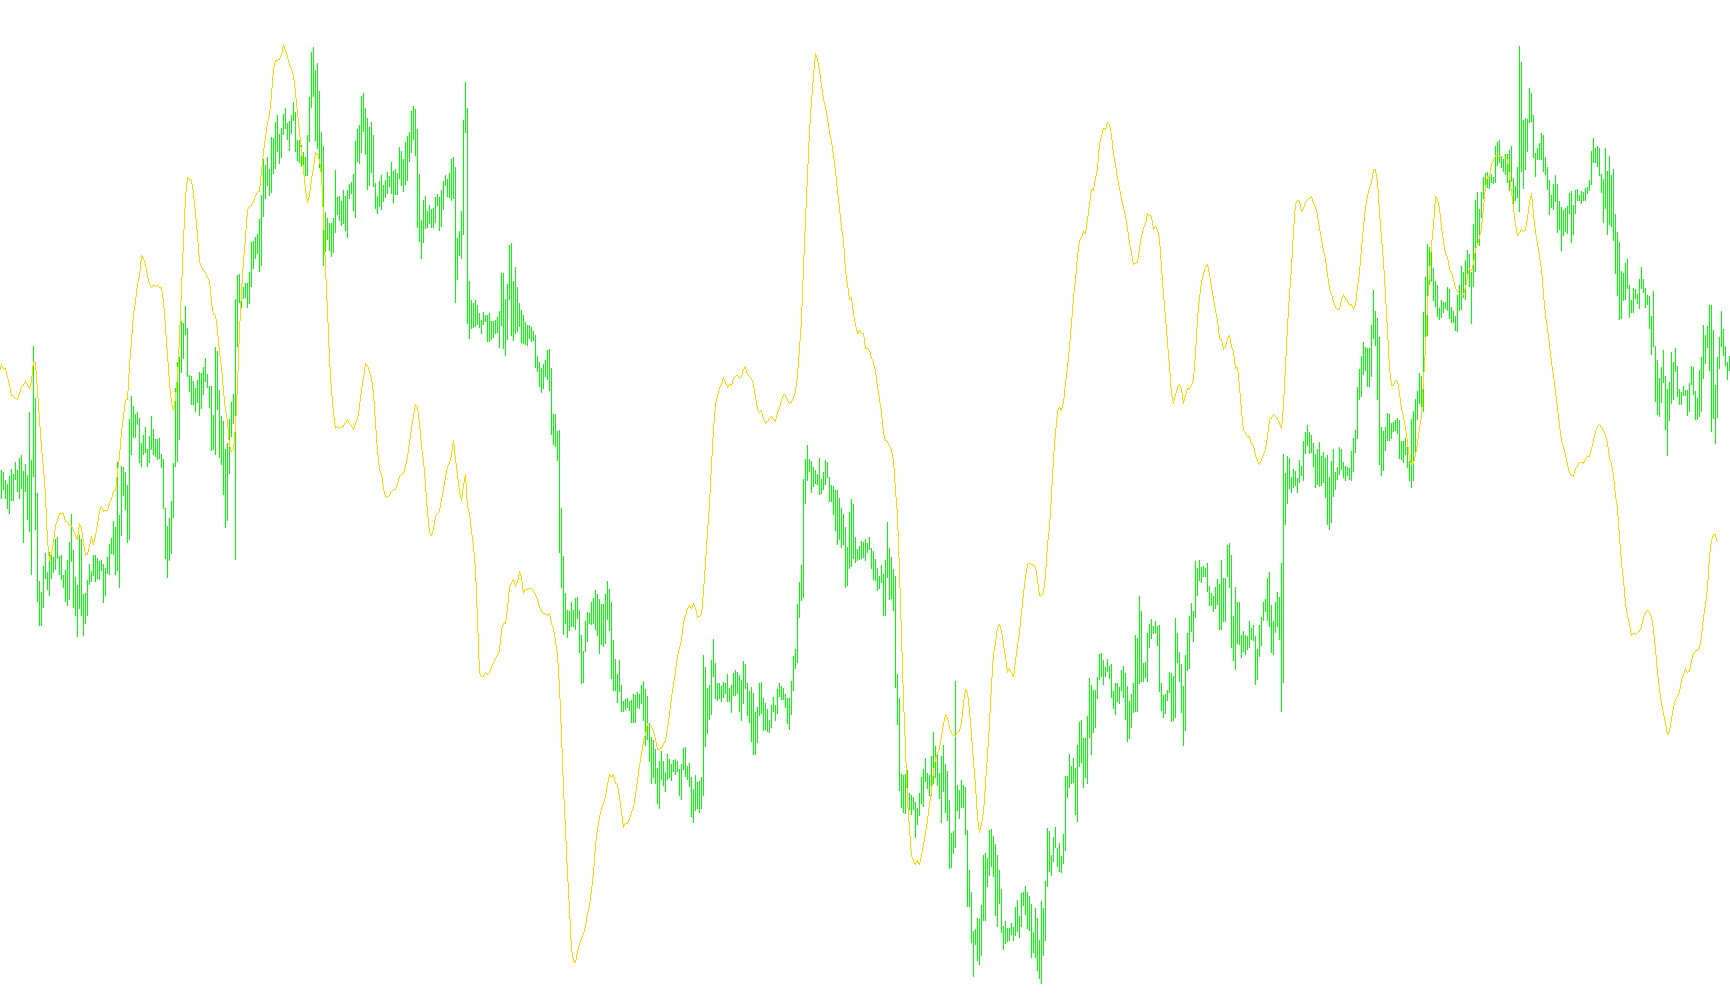
This tool is designed to provide a visual representation of market momentum by measuring the relative distance between two different moving averages. Instead of just showing you the price trend directly, it creates a dedicated data line in a separate window on your chart, making it easier to identify shifts in market strength at a glance.
How the Logic Works
The script operates by comparing two distinct timeframes of price averages simultaneously:
- Short-Term Average: This tracks the most recent price action over a smaller number of bars (defaulting to 7). It reacts quickly to immediate price fluctuations.
- Long-Term Average: This tracks the price over a larger number of bars (defaulting to 65), providing a broader view of the overall market direction.
The Calculation Process
To generate the final value you see on your screen, the script performs a three-step mathematical conversion:
- Difference Detection: It calculates the raw numerical difference between the short-term average and the long-term average.
- Relative Comparison: It takes that difference and divides it by the value of the long-term average. This "normalizes" the data, ensuring that the measurement remains consistent regardless of whether the asset price is at $10 or $10,000.
- Percentage Conversion: Finally, the result is multiplied by 100 to convert the movement into a percentage.
What This Means for the User
The resulting line on your chart represents the percentage gap between the short-term and long-term trends.
- When the line moves higher, it indicates that the short-term price is pulling away from the long-term average (increasing momentum).
- When the line moves lower, it indicates that the short-term price is dropping relative to the long-term trend.
- A flat line suggests that the short-term and long-term trends are moving in tandem, indicating a period of stability or consolidation.
By using this logic, the tool helps traders visualize "overextended" moves or potential reversals by showing how aggressively the current price is deviating from its historical average.
//+------------------------------------------------------------------+
//|                                                         RAVI.mq4 |
//|                      Copyright © 2005, MetaQuotes Software Corp. |
//|                                        http://www.metaquotes.net |
//+------------------------------------------------------------------+
#property copyright "Copyright © 2005, MetaQuotes Software Corp."
#property link      "http://www.metaquotes.net"

#property indicator_separate_window
#property indicator_buffers 1
#property indicator_color1 Red
//---- indicator parameters
extern int Period1=7;
extern int Period2=65;
//---- buffers
double ExtBuffer[];
//+------------------------------------------------------------------+
//| Custom indicator initialization function                         |
//+------------------------------------------------------------------+
int init()
  {
//---- indicators
   SetIndexStyle(0,DRAW_LINE);
   SetIndexBuffer(0,ExtBuffer);
   IndicatorShortName("RAVI (" + Period1+ ","+Period2+")");

//----
   return(0);
  }
//+------------------------------------------------------------------+
//| Custor indicator deinitialization function                       |
//+------------------------------------------------------------------+
int deinit()
  {
//---- TODO: add your code here

//----
   return(0);
  }
//+------------------------------------------------------------------+
//| Custom indicator iteration function                              |
//+------------------------------------------------------------------+
int start()
  {
   int    counted_bars=IndicatorCounted();
   int i=0;
   double SMA1,SMA2,result;


//---- TODO: add your code here

  for(i=0;i<Bars;i++)
   {
   SMA1=iMA(NULL,0,Period1,0,MODE_SMA,PRICE_CLOSE,i);
   SMA2=iMA(NULL,0,Period2,0,MODE_SMA,PRICE_CLOSE,i);
   result=((SMA1-SMA2)/SMA2)*100;
   ExtBuffer[i]=result;
   }

//----
   return(0);
  }
//+------------------------------------------------------------------+
Comments