Williams_Accumulation_Distribution
Download script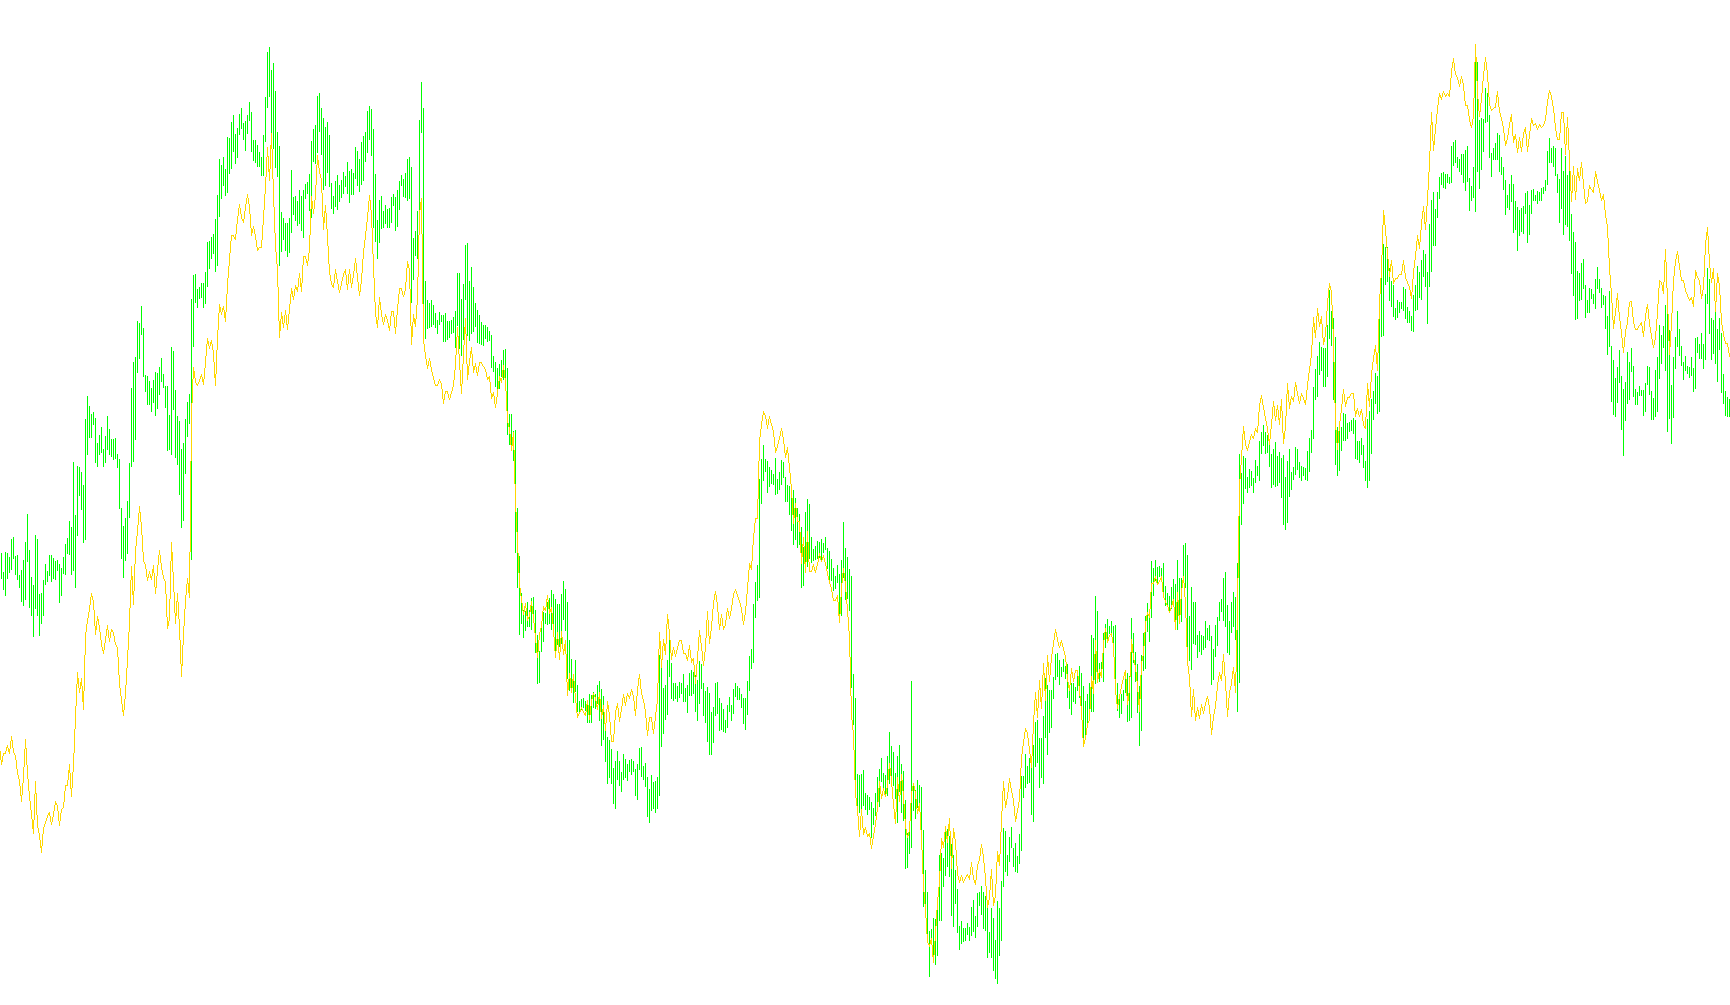
This script provides a visual tool for traders to understand the relationship between price movement and the "flow" of buying and selling pressure in a market. Unlike standard indicators that only look at the final closing price, this logic attempts to measure the volume-like distribution of where the price spent its time during a specific period.
How the Logic Works
The script operates by analyzing each individual candle on your chart and comparing it to the candle immediately preceding it. It follows a step-by-step process to determine how much "accumulation" or "distribution" occurred:
1. Identifying Range Extremes For every new price bar, the tool first looks at two specific boundaries:
- The highest point reached between the current high and the previous close.
- The lowest point reached between the current low and the previous close.
2. Evaluating Price Action The script then checks whether the price actually moved up, down, or stayed relatively flat:
- Upward Movement: If the current price closed higher than the previous price (by a minimum measurable amount), the tool calculates the distance between the closing price and the lowest point reached during that move.
- Downward Movement: If the current price closed lower than the previous price, it calculates the distance between the closing price and the highest point reached during that move.
- Neutral Movement: If the price barely moved or stayed flat, no value is added to the calculation for that period.
3. Cumulative Tracking Instead of showing you a single isolated number, the script adds these calculated values to a running total. This creates a continuous line in a separate window on your chart.
What This Means for You
The resulting line represents a "running tally" of price action. By watching how this line climbs or falls, you can get a sense of whether the market is steadily building strength in one direction (accumulation) or if it is being pushed down by heavy selling pressure (distribution). Because it accounts for the "range" of the movement rather than just the final closing price, it provides a more nuanced view of how aggressively the price traveled from point A to point B.
//+------------------------------------------------------------------+
//|                          Williams' Accumulation/Distribution.mq4 |
//|                      Copyright © 2007, MetaQuotes Software Corp. |
//|                                        http://www.metaquotes.net |
//+------------------------------------------------------------------+
#property copyright "Copyright © 2007, MetaQuotes Software Corp."
#property link      "http://www.metaquotes.net"
//----
#property indicator_separate_window
#property indicator_buffers 1
#property indicator_color1 LightSeaGreen
//---- buffers
double ExtMapBuffer1[];
//+------------------------------------------------------------------+
//| Custom indicator initialization function                         |
//+------------------------------------------------------------------+
int init()
  {
   IndicatorShortName("W_A/D");
//---- indicators
   SetIndexStyle(0, DRAW_LINE);
   SetIndexBuffer(0, ExtMapBuffer1);
//----
   return(0);
  }
//+------------------------------------------------------------------+
//| Custom indicator deinitialization function                       |
//+------------------------------------------------------------------+
int deinit()
  {
//----
   return(0);
  }
//+------------------------------------------------------------------+
//| Custom indicator iteration function                              |
//+------------------------------------------------------------------+
int start()
  {
   double AD, TRH, TRL;
   int  i, counted_bars = IndicatorCounted();
//----
   i = Bars - counted_bars - 1;
   while(i >= 0)
     {
       TRH = MathMax(High[i], Close[i+1]);
       TRL = MathMin(Low[i], Close[i+1]);
       if(Close[i] > Close[i+1] + Point)
           AD = Close[i] - TRL;
       else
           if(Close[i] < Close[i+1] - Point)
               AD = Close[i] - TRH;
           else
               AD = 0;
       ExtMapBuffer1[i] = ExtMapBuffer1[i+1] + AD;
       i--;
     }
//----
   return(0);
  }
//+------------------------------------------------------------------+
Comments