RSI HistoAlert v2
Download script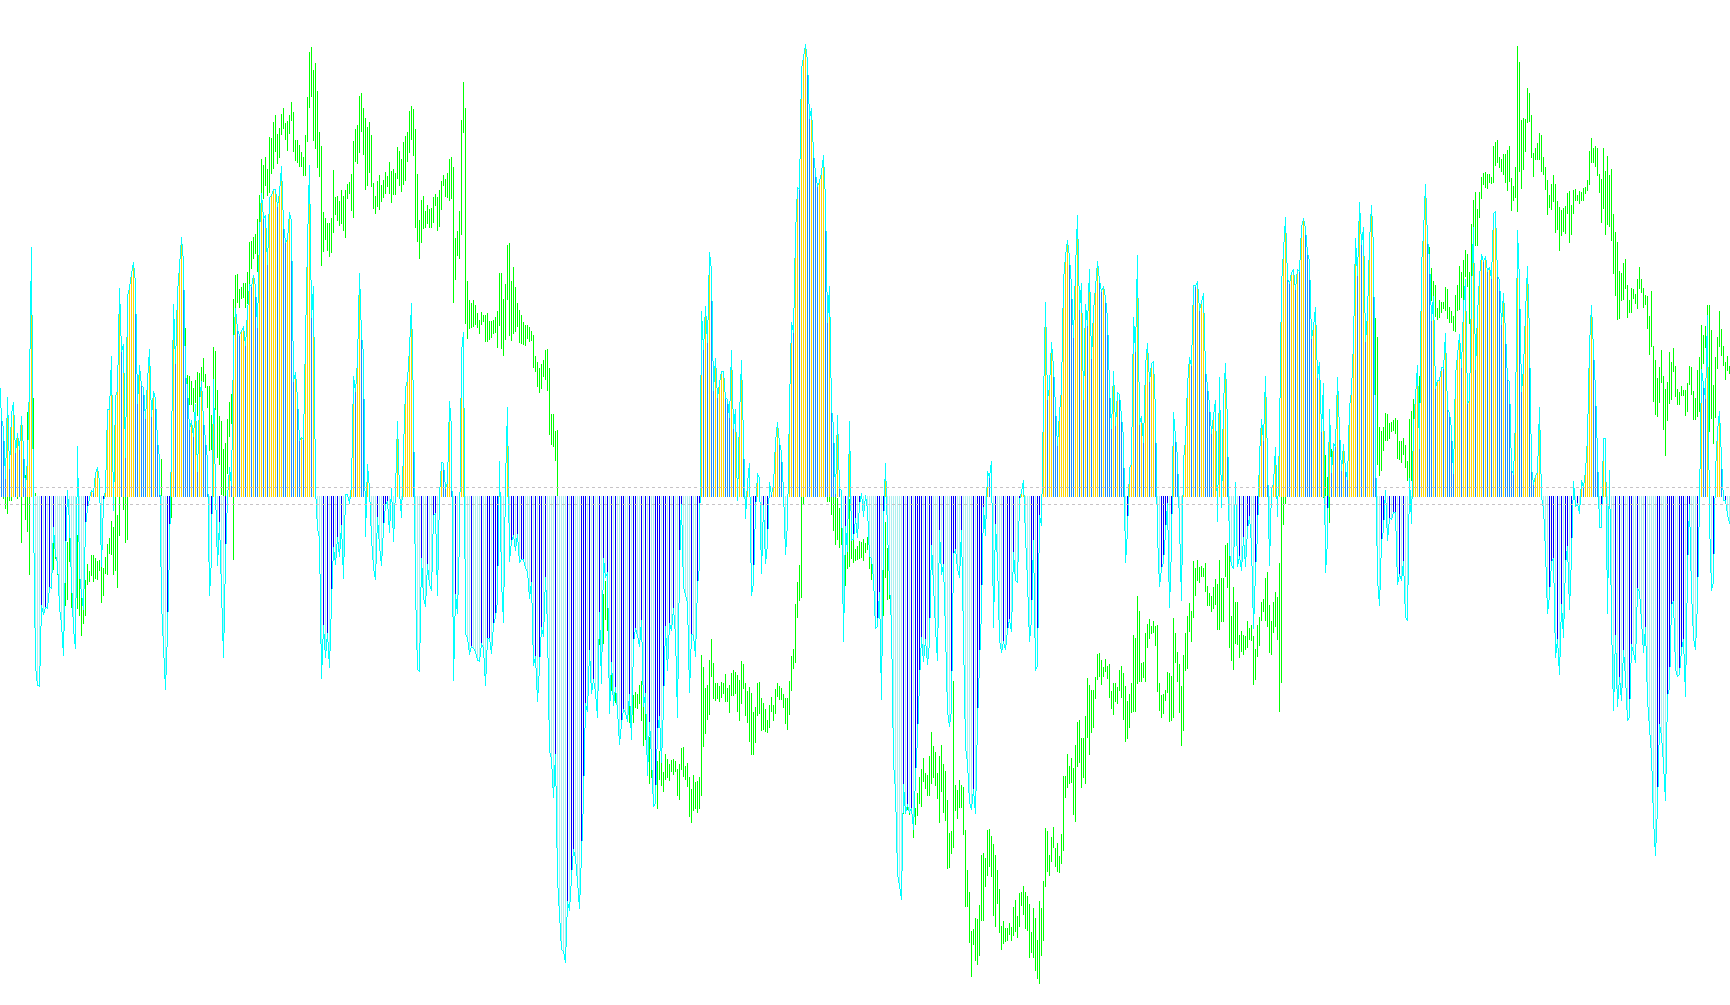
This script is a custom technical analysis indicator designed for the MetaTrader platform. Its primary purpose is to monitor momentum and price trends by processing Relative Strength Index (RSI) data into a visual "histogram" format, providing traders with clear cues on market direction and potential entry points.
Core Logic and Functionality
1. Data Transformation The script takes standard RSI values and modifies them to create a more reactive visual output. It centers the data around a zero-line (shifting the traditional 50-level baseline) and applies a multiplier. This transformation allows the indicator to behave like a momentum oscillator, where values above zero generally suggest upward momentum and values below zero suggest downward momentum.
2. Visual Representation (Four-Color System) The most distinct feature of this tool is its ability to categorize market movement into four different visual states based on two factors: the direction of the current bar relative to the previous one, and whether the value is currently in positive or negative territory.
- It detects if the momentum is increasing or decreasing.
- It distinguishes between "Positive" growth and "Negative" decline.
- By combining these two factors, the indicator uses different colors to represent various market conditions (e.g., accelerating upward, slowing downward, etc.), allowing for a quick glance at the "strength" of a trend.
3. Signal Smoothing In addition to the histogram, the script calculates a Moving Average (MA) based on the processed RSI data. This "Signal Line" helps smooth out market noise, providing a secondary reference point to confirm trends and identify where the momentum is beginning to shift or stabilize.
4. Automated Alert System The script includes an integrated notification system. It monitors the indicator's levels against specific user-defined thresholds (Buy and Sell alert levels). When the momentum crosses these designated boundaries, the tool can trigger a real-time pop-up alert on the trading platform, notifying the user of a potential signal without requiring them to watch the screen constantly.
Summary for the User
Essentially, this tool converts standard RSI data into a dynamic, multi-colored histogram. It helps you visualize not just if the price is moving, but how strongly it is moving by highlighting changes in momentum and trend velocity in real-time, while providing optional automated alerts when significant momentum shifts occur.
#property copyright "BLUR71"
#property link      "blrobertsjr@hotmail.com"
#property indicator_separate_window
#property indicator_buffers 6
#property indicator_color1 Blue
#property indicator_width1 4
#property indicator_color2 Coral
#property indicator_width2 4
#property indicator_color3 Red
#property indicator_width3 4
#property indicator_color4 CornflowerBlue
#property indicator_width4 4
#property indicator_color5 Black
#property indicator_width5 2
#property indicator_color6 Lime
#property indicator_width6 0
#property indicator_style6 2

#property indicator_level3 -7
#property indicator_level4 7
#property indicator_level5 -5
#property indicator_level6 5
#property indicator_level7 3
#property indicator_level8 -3

#property indicator_levelcolor LightGray
#property indicator_levelstyle 0
#property indicator_levelwidth 4
#define   indicator_minimum -40
#define   indicator_maximum  40
extern bool AlertOn=false, /*ColorDescendingBars=true,*/PlotMainLine=true, PlotSignalLine=false,FourColorBars=true;
extern int  RSIPeriod=13,RSIPrice=0,MASignal=13,MAMode=0,BuyAlertLevel=-1,SellAlertLevel=1;
extern double RSIHistoModify=1.5;
double UpBuffer[],DownBuffer[],UpBuffer2[],DownBuffer2[],RSIMain[],RSISignal[];
int Positive=0, Negative=0;
//----
int init()
  {IndicatorBuffers(6);
   SetIndexStyle(0,2); SetIndexBuffer(0,UpBuffer);    SetIndexEmptyValue(0,EMPTY_VALUE);
   SetIndexStyle(1,2); SetIndexBuffer(1,UpBuffer2);   SetIndexEmptyValue(1,EMPTY_VALUE);
   SetIndexStyle(2,2); SetIndexBuffer(2,DownBuffer);  SetIndexEmptyValue(2,EMPTY_VALUE);
   SetIndexStyle(3,2); SetIndexBuffer(3,DownBuffer2); SetIndexEmptyValue(3,EMPTY_VALUE);
   if(PlotMainLine)    SetIndexStyle(4,0);else SetIndexStyle(4,12); SetIndexBuffer(4,RSIMain);
   if (PlotSignalLine) SetIndexStyle(5,0);else SetIndexStyle(5,12); SetIndexBuffer(5,RSISignal);
   SetLevelValue(0,BuyAlertLevel); SetLevelValue(1,SellAlertLevel);
   return(0);}
//----
int deinit() {return(0);}
//----
int start()
{double prev,curr;
 int counted_bars=IndicatorCounted(),I,limit;
 IndicatorShortName("RSI HistoAlert ["+RSIPeriod+","+RSIPrice+","+MASignal+
                    ","+MAMode+","+DoubleToStr(RSIHistoModify,2)+"X]");
 if (counted_bars<0) return(-1);
 if (counted_bars>0) counted_bars--;
 limit=Bars-31;
 if(counted_bars>=31) limit=Bars-counted_bars-1;
//----
   for (I=limit;I>=0;I--)
   {RSIMain[I]=((iRSI(0,0,RSIPeriod,RSIPrice,I)-50)*RSIHistoModify);
      if(RSIMain[I]>BuyAlertLevel)
      {if (Positive==0)
       {Positive=1;Negative=0;
        if (I == 1 && AlertOn ) Alert(Symbol()," M",Period()," RSI Histo BUY @ ",Ask);}}
      else if (RSIMain[I]<SellAlertLevel)
      {if(Negative==0)
       {Negative=1;Positive=0;
        if (I == 1 && AlertOn) Alert(Symbol()," M",Period()," RSI Histo SELL @ ",Ask);}}
  if(FourColorBars==true)
   {bool up=true;
    UpBuffer[I]=0.0;UpBuffer2[I]=0.0;DownBuffer[I]=0.0;DownBuffer2[I]=0.0;
    curr=RSIMain[I];prev=RSIMain[I+1];
    if(curr>prev) up=true; if(curr<prev) up=false;
    if(up)
    {if(curr>0){UpBuffer[I]=curr;UpBuffer2[I]=0;DownBuffer[I]=0;DownBuffer2[I]=0;}
      else     {UpBuffer[I]=0;UpBuffer2[I]=curr;DownBuffer[I]=0;DownBuffer2[I]=0;}}
    else
    {if(curr<0){UpBuffer[I]=0;UpBuffer2[I]=0;DownBuffer[I]=curr;DownBuffer2[I]=0;}
      else     {UpBuffer[I]=0;UpBuffer2[I]=0;DownBuffer[I]=0;DownBuffer2[I]=curr;}}
    }
    //giving wierd colors on display.  will fix later incorporating all version in one.
    //this is the simplified version
    /*if(ColorDescendingBars==true && FourColorBars==false)
    {if (RSIMain[I]>RSIMain[I+1])
      {UpBuffer[I]=RSIMain[I];
       DownBuffer[I]=EMPTY_VALUE;}
     else
      {DownBuffer[I]=RSIMain[I];
       UpBuffer[I]=EMPTY_VALUE;}}

     else if(ColorDescendingBars==false && FourColorBars==false && RSIMain[I]>=0.00)
      {UpBuffer[I]=RSIMain[I];}
     else
      {DownBuffer[I]=RSIMain[I];}*/
   }
for(I=0; I<limit; I++)
    RSISignal[I]=iMAOnArray(RSIMain,Bars,MASignal,0,MAMode,I);
return(0);
}
Comments