RSI_MA_LevelSignal
Download script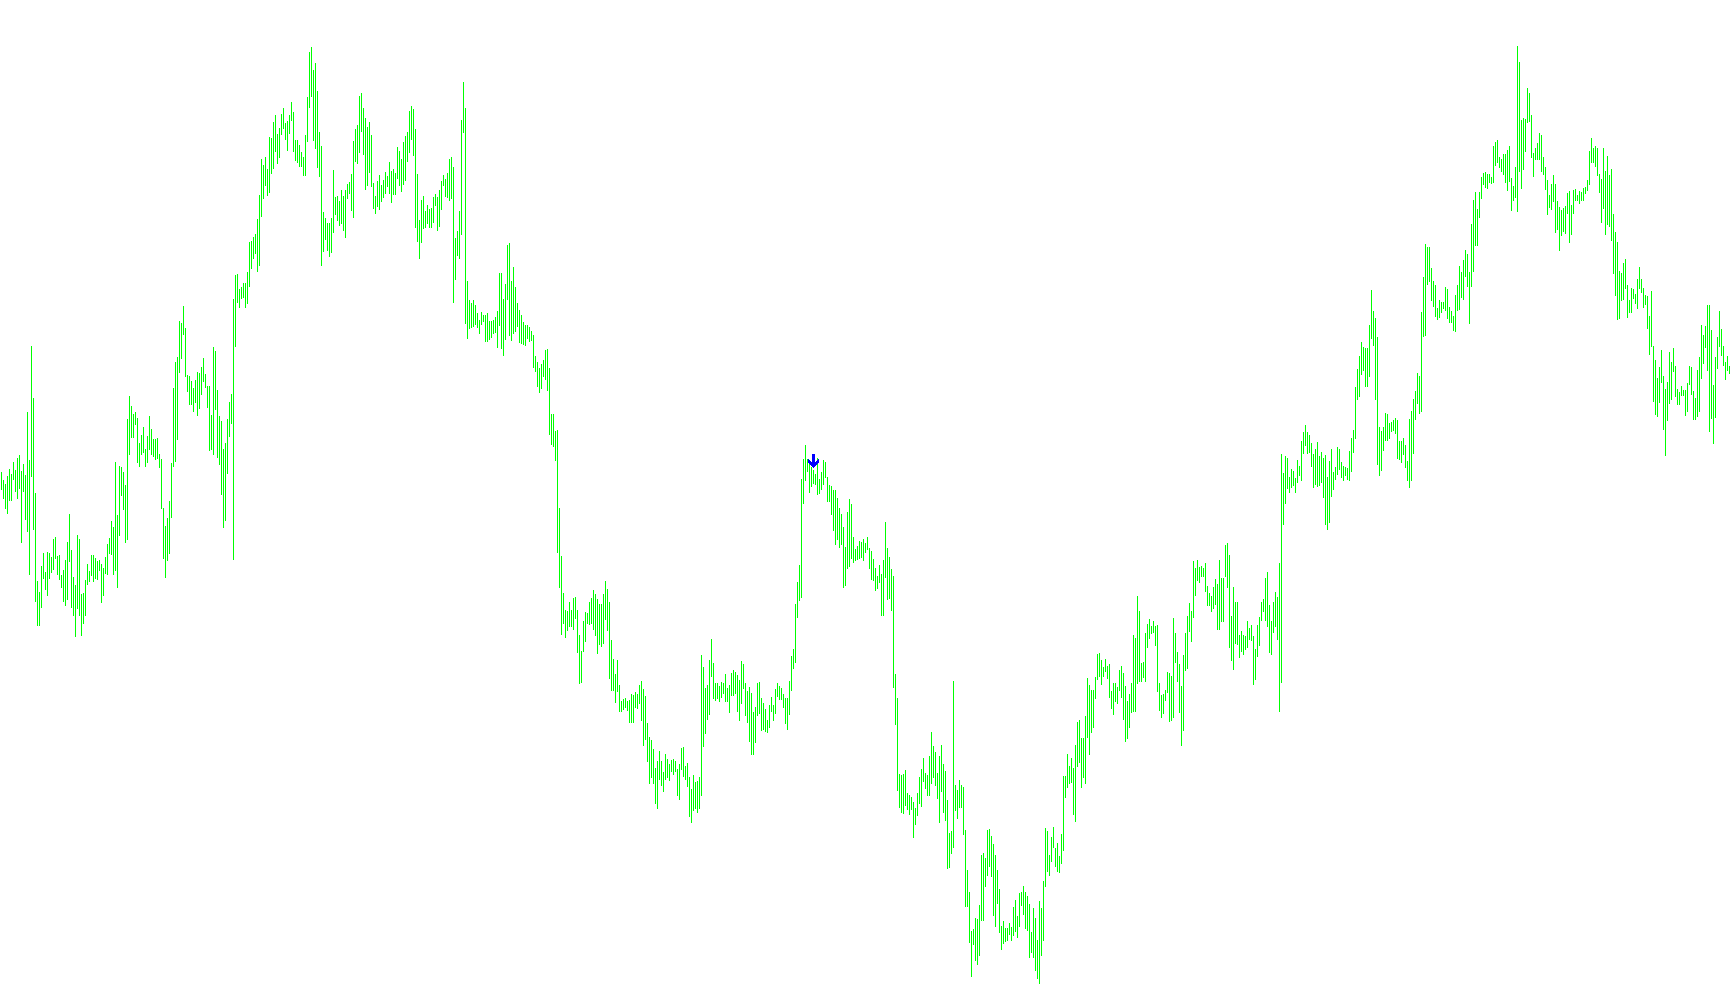
This trading tool is designed to identify specific price momentum shifts by analyzing the relationship between market volatility, historical averages, and relative strength. It works by looking for a "perfect storm" of conditions where several technical factors align simultaneously before placing a visual signal on your chart.
How the Logic Works
The script continuously scans the market data to evaluate three primary components:
1. Volatility Analysis Before making any calculations, the tool first measures the recent "heartbeat" of the market. It looks at the price range (the distance between the highest and lowest prices) over a set number of candles to determine the average volatility. This ensures that the signals it produces are adjusted to the current market environment—whether the market is moving calmly or experiencing high turbulence.
2. Momentum & Strength (RSI) The tool utilizes the Relative Strength Index (RSI) to measure how fast and how far prices are moving. It specifically looks for "breakout" moments in momentum:
- For Buy Signals: It looks for instances where the momentum has been climbing out of a low zone (moving above a specific threshold), indicating that strength is returning to the asset.
- For Sell Signals: It looks for instances where momentum is dropping out of a high zone, suggesting that the upward move is exhausting and losing steam.
3. Long-Term Trend Filtering (Moving Averages) To prevent "false positives" during choppy markets, the tool uses two different Exponential Moving Averages (EMAs). These act as a filter to ensure you are trading in the direction of the dominant trend:
- It checks if the faster moving average is positioned above the slower one to confirm an overall upward trend.
- It checks if the faster moving average is below the slower one to confirm an overall downward trend.
Signal Execution
The tool only triggers a visual signal when all these conditions meet at the same time:
- The Buy Signal (Aqua Arrow): Occurs when momentum starts recovering from a low point AND the long-term trend is confirmed to be moving upward. The signal appears slightly below the current price candle.
- The Sell Signal (Red Arrow): Occurs when momentum begins to fail from a high point AND the long-term trend is confirmed to be moving downward. The signal appears slightly above the current price candle.
By combining these three layers—volatility, momentum, and trend filtering—the script aims to filter out "noise" and highlight moments where short-term price action aligns with the broader market direction.
//+------------------------------------------------------------------+
//|                          RSI_MA_LevelSignal "HI_Line_Indicators" |
//|                                                       íà îñíîâå  |
//|                                         SMA-Crossover_Signal.mq4 |
//+------------------------------------------------------------------+

#property copyright "Copyright © 2009, Helen_Iv"
#property link      "http://helenclubfinance.com"

#property indicator_chart_window
#property indicator_buffers 2
#property indicator_color1 Aqua
#property indicator_color2 Red

double CrossUp[];
double CrossDown[];

extern int Len = 26;
extern int ma2=480;
extern int ma3=960;

//+------------------------------------------------------------------+
//| Custom indicator initialization function                         |
//+------------------------------------------------------------------+
int init()
  {
//---- indicators
   SetIndexStyle(0, DRAW_ARROW, EMPTY);
   SetIndexArrow(0, 233);
   SetIndexBuffer(0, CrossUp);
   SetIndexStyle(1, DRAW_ARROW, EMPTY);
   SetIndexArrow(1, 234);
   SetIndexBuffer(1, CrossDown);
//----
   return(0);
  }
//+------------------------------------------------------------------+
//| Custom indicator deinitialization function                       |
//+------------------------------------------------------------------+
int deinit()
  {
//----

//----
   return(0);
  }
//+------------------------------------------------------------------+
//| Custom indicator iteration function                              |
//+------------------------------------------------------------------+
int start()
{
   int limit, i, counter;
   double t1,t11,t2,t3;
   double Range, AvgRange;
   int counted_bars=IndicatorCounted();
//---- check for possible errors
   if(counted_bars<0) return(-1);
//---- last counted bar will be recounted
   if(counted_bars>0) counted_bars--;

   limit=Bars-counted_bars;

   for(i = 1; i <= limit; i++)
   {
      counter=i;
      Range=0;
      AvgRange=0;
      for (counter=i ;counter<=i+9;counter++)
      {
         AvgRange=AvgRange+MathAbs(High[counter]-Low[counter]);
      }
      Range=AvgRange/10.0;

      t1  =iRSI(NULL, 0, Len, PRICE_CLOSE, i);
      t11 =iRSI(NULL, 0, Len, PRICE_CLOSE, i+1);
      t2  =iMA( NULL, 0, ma2, 0, MODE_EMA, 0, i);
      t3  =iMA( NULL, 0, ma3, 0, MODE_EMA, 0, i);

      if (t1>30.0 && t11<30.0 && t1>t11 && t2>t3)
      {
         CrossUp[i] = Low[i] - Range*0.2;
      }
      if (t1<70.0 && t11>70.0 && t1<t11 && t2<t3)
      {
         CrossDown[i] = High[i] + Range*0.2;
      }
   }
   return(0);
}
Comments