rsi_monitor
Download script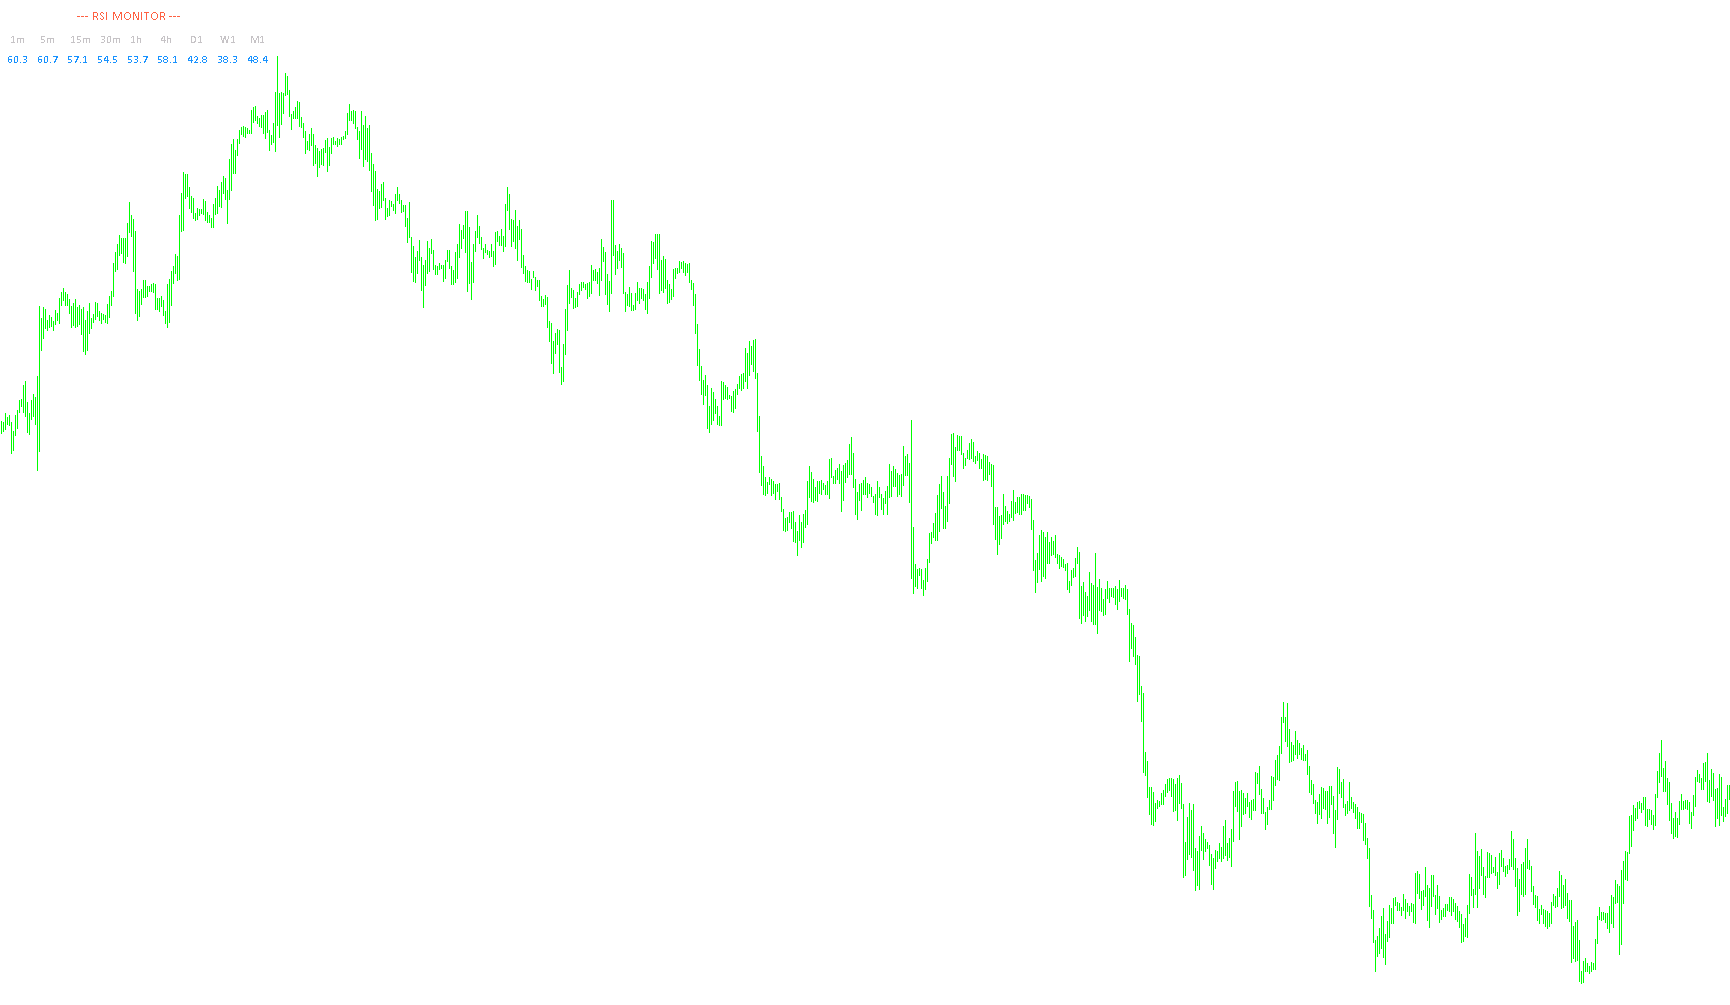
Overview
The RSI Monitor is a specialized visual dashboard designed for MetaTrader users to track the Relative Strength Index (RSI)—a popular momentum oscillator—across multiple timeframes simultaneously. Instead of requiring you to switch between different charts to see how a market is behaving, this tool aggregates that data into a single, clean on-screen panel.
Key Functionalities
Multi-Timeframe Monitoring
The script automatically scans nine different timeframes (ranging from 1-minute intervals to monthly views). For each timeframe, it calculates the current RSI value based on your preferred settings. This allows for an immediate "bird's-eye view" of market trends, helping you identify if a currency or asset is becoming overextended in the short term versus the long term.
Visual Dashboard Display
The tool creates a customizable on-screen interface that displays:
- Timeframe Labels: Clearly identifies which timeframe each value belongs to.
- Live RSI Values: Shows the exact numerical RSI for every period.
- Visual Status Indicators: Uses color-coded icons to signal market conditions:
- Overbought: Highlights when the RSI exceeds your designated upper limit (e.g., 70).
- Oversold: Highlights when the RSI falls below your designated lower limit (e.g., 30).
- Normal: Indicates that the price is currently in a neutral range.
Intelligent Alert System
To ensure you never miss a critical market shift, the script features a notification system that triggers only once per candle. This prevents the "spamming" of alerts during high volatility. You can choose to receive these notifications via four different methods:
- Pop-up Alerts: On-screen messages within the trading platform.
- Email Notifications: Sent directly to your registered email address.
- Push Notifications: Sent to your mobile device (if configured).
- Audio Alerts: A specific sound file that plays to grab your attention.
User Customization
The logic is built to be flexible, allowing you to adjust the following without technical knowledge:
- Appearance: You can change the colors of the background, text, and icons, as well as the font style and panel positioning on your screen.
- Technical Parameters: You can define the RSI period (the lookback window), the specific price type used for calculation, and the exact numerical thresholds for "Overbought" and "Oversold" conditions.
- Alert Preferences: You can toggle any of the four notification types on or off depending on your trading style.
//+------------------------------------------------------------------+
//|                                                  RSI Monitor.mq4 |
//|                                          Copyright 2015, Awran5. |
//|                                                 awran5@yahoo.com |
//+------------------------------------------------------------------+
#property copyright "Copyright 2015, Awran5."
#property link      "awran5@yahoo.com"
#property version   "1.01"
#property description "Clean panel that shows RSI values on all timeframes with Oversold and Overbought Notification"
#property strict
#property indicator_chart_window
input string               lb_0              = "";              // ----------- PANEL -----------
extern ENUM_BASE_CORNER    Corner            = 0;               // Panel Side
extern bool                AllowSubwindow    = false;           // Allow sub window
extern color               Pbgc              = C'10,10,10';     // Panel Backgroud color
extern color               Ptc               = clrTomato;       // Panel Title color
extern string              Pfn               = "Calibri";       // Panel Font Name
extern color               Pfc               = clrSilver;       // Panel Text Color
extern color               Pvc               = clrDodgerBlue;   // Panel Values Color
extern color               obic              = clrLime;         // OverBought icon color
extern color               osic              = clrRed;          // OverSold icon color
extern color               nic               = clrGray;         // Normal icon color
input string               lb_1              = "";              // ----------- RSI -----------
extern int                 RSIPeriod         = 14;              // RSI period
extern ENUM_APPLIED_PRICE  RSIApplied        = 0;               // RSI Applied Price
extern double              MinRSI            = 30;              // RSI OverSold Level
extern double              MaxRSI            = 70;              // RSI OverBought Level
input string               lb_2              = "";              // ----------- NOTIFICATION -----------
input bool                 UseAlert          = false;           // Enable Alert
input bool                 UseEmail          = false;           // Enable Email
input bool                 UseNotification   = false;           // Enable Notification
input bool                 UseSound          = false;           // Enable Sound
input string               SoundName         = "alert2.wav";    // Sound Name

string iName;
//+------------------------------------------------------------------+
//| Custom indicator initialization function                         |
//+------------------------------------------------------------------+
int OnInit()
  {
//--- indicator buffers mapping

   iName="RSI Monitor";
   IndicatorShortName(iName);
//---
   return(INIT_SUCCEEDED);
  }
//+------------------------------------------------------------------+
//| deinitialization function                                        |
//+------------------------------------------------------------------+
void OnDeinit(const int reason)
  {
//---
   for(int i=ObjectsTotal(); i>=0; i--)
     {
      string name=ObjectName(i);
      if(StringFind(name,iName)==0) ObjectDelete(name);
     }
//---
  }
//+------------------------------------------------------------------+
//| Custom indicator iteration function                              |
//+------------------------------------------------------------------+
int OnCalculate(const int rates_total,
                const int prev_calculated,
                const datetime &time[],
                const double &open[],
                const double &high[],
                const double &low[],
                const double &close[],
                const long &tick_volume[],
                const long &volume[],
                const int &spread[])
  {
//--- draw background "webdings" font
   Draw("BG","ggg",70,"Webdings",Pbgc,Corner,1,1);
//--- draw background title
   Draw("Title","--- RSI MONITOR ---",10,Pfn,Ptc,Corner,80,10);
//--- define arrays and vars
   string TimeFrames[9]={"1m","5m","15m","30m","1h","4h","D1","W1","M1"};
   int period[9]={1,5,15,30,60,240,1440,10080,43200};
   double rsi[9]={};
//--- create timeframe labels
   for(int i=0; i<9; i++)
     {
      Draw("Period "+(string)i,TimeFrames[i],8,Pfn,Pfc,Corner,i*30+13,35);
      //--- create values and icons
      rsi[i]=iRSI(NULL,period[i],RSIPeriod,RSIApplied,0);
      Draw("Value "+(string)i,DoubleToStr(rsi[i],1),8,Pfn,Pvc,Corner,i*30+10,55);
      //--- overbought, oversold icons and alert
      if(rsi[i]>MaxRSI)
        {
         Draw("Overbought "+(string)i,CharToStr(108),8,"Wingdings",obic,Corner,i*30+15,75);
         doAlert("RSI has entered in OVERBOUGHT Zone at "+Symbol()+" on "+PeriodToStr(period[i])+" time frame");
        }
      else if(rsi[i]<MinRSI)
        {
         Draw("Oversold "+(string)i,CharToStr(108),8,"Wingdings",osic,Corner,i*30+15,75);
         doAlert("RSI has entered in OVERSOLD Zone at "+Symbol()+" on "+PeriodToStr(period[i])+" time frame");
        }
      else Draw("Normal "+(string)i,CharToStr(108),8,"Wingdings",nic,Corner,i*30+15,75);
     }
//--- return value of prev_calculated for next call
   return(rates_total);
  }
//+------------------------------------------------------------------+
//| alert function
//+------------------------------------------------------------------+
bool doAlert(string message)
  {
//--- See if this bar is new and conditions are met
   static datetime TimeNow;
   if(TimeNow!=Time[0])
     {
      if(UseAlert) Alert(message);
      if(UseEmail) SendMail("RSI Notification!",message);
      if(UseSound) PlaySound(SoundName);
      if(UseNotification) SendNotification(message);
      // Store the time of the current bar, preventing further action during this bar
      TimeNow=Time[0];
      return(true);
     }
   return(false);
//---
  }
//+------------------------------------------------------------------+
//| draw function
//+------------------------------------------------------------------+
void Draw(string name,string label,int size,string font,color clr,int corner,int x,int y)
  {
//---
   name=iName+": "+name;
   int windows=0;
   if(AllowSubwindow && WindowsTotal()>1) windows=1;
   ObjectDelete(name);
   ObjectCreate(name,OBJ_LABEL,windows,0,0);
   ObjectSetText(name,label,size,font,clr);
   ObjectSet(name,OBJPROP_CORNER,corner);
   ObjectSet(name,OBJPROP_XDISTANCE,x);
   ObjectSet(name,OBJPROP_YDISTANCE,y);
//---
  }
//+------------------------------------------------------------------+
//| Period To String - Credit to the author
//+------------------------------------------------------------------+

string PeriodToStr(int tf)
  {
//---
   if(tf == NULL) return(PeriodToStr(Period()));
   int p[9]={1,5,15,30,60,240,1440,10080,43200};
   string sp[9]={"M1","M5","M15","M30","H1","H4","D1","W1","MN1"};
   for(int i= 0; i < 9; i++) if(p[i] == tf) return(sp[i]);
   return("--");
//---
  }
//+-------------------------- END -----------------------------------+
Comments