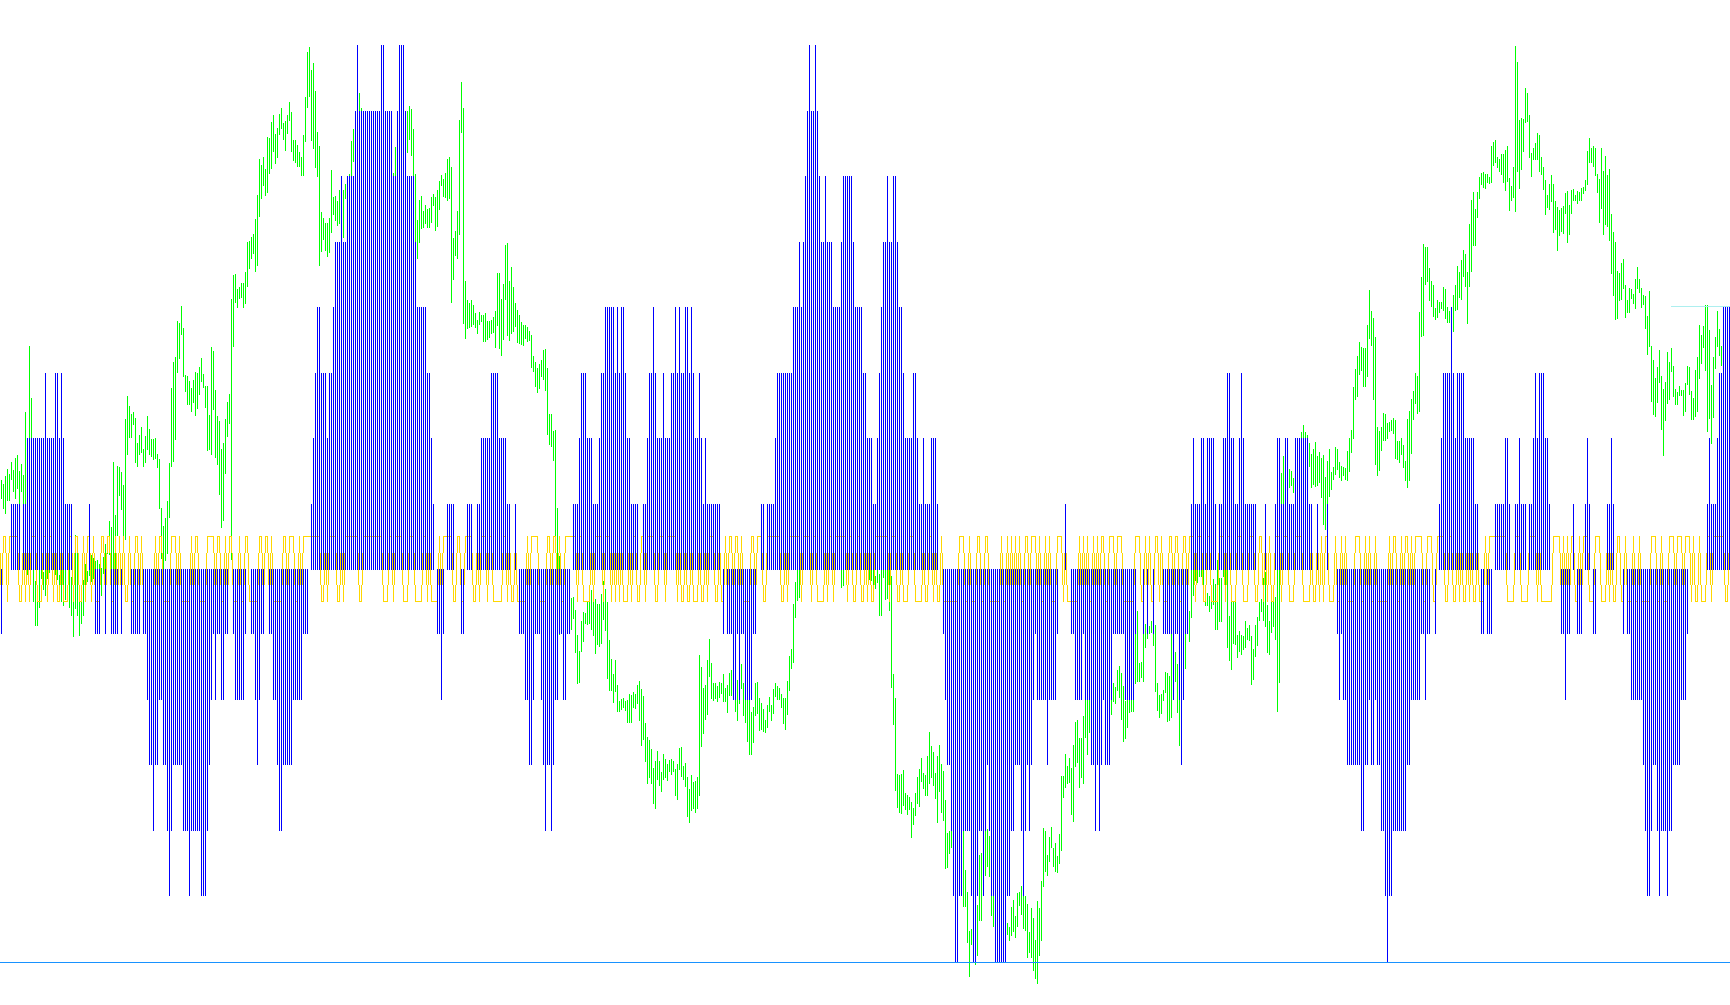
This technical indicator is designed to analyze market momentum and potential trend reversals by tracking the relationship between opening and closing prices over a specific period. Rather than looking at price in isolation, it focuses on the "direction of movement" to determine if the market is gaining significant strength or exhausting itself.
Core Logic and Methodology
1. Price Movement Calculation The script begins by measuring the difference between a candle's opening and closing price. Depending on the settings chosen, it can calculate this in two ways:
- Raw Difference: Calculating the actual numerical distance between the open and close.
- Directional Polarities: Converting the movement into a simple "+1" (for upward moves) or "-1" (for downward moves). This simplifies the data into a "net direction" score.
2. Cumulative Summation Instead of looking at just the most recent candle, the script maintains a rolling sum of these movements over a user-defined period (e.g., 30 candles). By adding up all the "+1s" and "-1s" (or raw differences) within this window, the indicator creates a cumulative "momentum score."
3. Dynamic Range Analysis The script monitors this momentum score against specific thresholds. It identifies the highest and lowest scores achieved over an extended look-back period. This allows the tool to understand what "normal" volatility looks like for the current market conditions, providing context for whether a price move is standard or extreme.
Trend Identification and Alerts
The logic follows a specific "Rule of 9" concept to identify exhaustion:
- Strength Tracking: The indicator counts how many consecutive candles the momentum score remains above a high threshold (8) or below a low threshold (-8).
- Trend Change Alerts: When the market stays in an extreme state for a prolonged period—specifically reaching a count of 9—the script recognizes that the trend may be reaching a point of exhaustion.
At this specific moment, the script triggers a visual alert to notify the user of a Potential Trend Change. This serves as a warning that the current move may be overextended and a reversal could be imminent.
User Customization
The logic is flexible, allowing users to:
- Select Timeframes: View data across different intervals (e.g., 5-minute, Hourly, or Daily).
- Adjust Calculation Styles: Choose between three different mathematical models for measuring price gaps to suit different trading styles.
- Modify Sum Periods: Change how many candles are included in the momentum calculation to make the indicator more sensitive or more stable.
//+------------------------------------------------------------------+
//|                                                      RuleOf9.mq4 |
//+------------------------------------------------------------------+
#property indicator_separate_window
#property indicator_buffers 4
#property indicator_color1 Yellow
#property indicator_color2 DodgerBlue
#property indicator_color3 LimeGreen
#property indicator_color4 OrangeRed
#property indicator_level1 0
#property indicator_level2 8
#property indicator_level3 -8

extern string TimeFrame_value = "TimeFrame(0,M5,M15,M30,H1,D1)";
extern string TimeFrame = "0";
extern int SumPeriod = 30;
extern string Sum_Mode = "0=Close-Open, 1=+1/-1";
extern int SumMode = 1;
extern string Day_Calculation_Type = "0=Brian,1=Logical Trader,2=Amibroker";
extern int Calculation_Type = 0;

double P, PRU, PRD, R, D;

double LastValue[];
double HSum[];
double LSum[];
double SumValue[];

int LastBar = -1;

double HCount[];
double LCount[];

double HigherTimeFrameValue[];
int timeFrame = 0;

int init() {

   IndicatorBuffers(4);

   SetIndexStyle(0,DRAW_LINE);
   SetIndexBuffer(0,LastValue);
   SetIndexLabel(0,"Price_C_O");
   SetIndexStyle(1,DRAW_HISTOGRAM);
   SetIndexBuffer(1,SumValue);
   SetIndexLabel(1,"C_O_Sum(" + SumPeriod + ")");
   SetIndexStyle(2,DRAW_LINE, STYLE_SOLID);
   SetIndexBuffer(2,HSum);
   SetIndexLabel(2,"Highest Sum");
   SetIndexStyle(3,DRAW_LINE, STYLE_SOLID);
   SetIndexBuffer(3,LSum);
   SetIndexLabel(3,"Lowest Sum");

   SetIndexStyle(4,DRAW_LINE, STYLE_SOLID);
   SetIndexBuffer(4,LSum);
   SetIndexLabel(4,"Lowest Sum");

   for(int idx=0; idx < SumPeriod; idx++) {

      SumValue[idx] = 0.0;
      HCount[idx] = 0.0;
      LCount[idx] = 0.0;
      HSum[idx] = 0.0;
      LSum[idx] = 0.0;
      LastValue[idx] = 0.0;

   }

   if (TimeFrame == "M5") {

      timeFrame = PERIOD_M5;

   } else if (TimeFrame == "M15") {

      timeFrame = PERIOD_M15;

   } else if (TimeFrame == "M30") {

      timeFrame = PERIOD_M30;

   } else if (TimeFrame == "H1") {

      timeFrame = PERIOD_H1;

   } else if (TimeFrame == "H4") {

      timeFrame = PERIOD_H4;

   } else if (TimeFrame == "D1") {

      timeFrame = PERIOD_D1;

   } else {

      timeFrame = 0;

   }

   LastBar = iTime(NULL, 0, 0);

   return(0);

}

int deinit() {

   return(0);

}

int start() {

   int i, counted_bars = IndicatorCounted();
   i = Bars - counted_bars - 1;
   double sum = 0;

   if (i < SumPeriod) {

      i = SumPeriod;

   }

   while (i >= 0) {

      if (iTime(NULL, timeFrame, i) != LastBar) {

         LastBar = iTime(NULL, timeFrame, i);
         sum = 0;

         if (Calculation_Type == 0 || (Calculation_Type != 1 && Calculation_Type != 2)) {

            D = (iOpen(NULL, timeFrame, i) - iClose(NULL, timeFrame, i+1));

         } else if (Calculation_Type == 1) {

            D = (iClose(NULL, timeFrame, i+1) - iOpen(NULL, timeFrame, i+1));

         } else if (Calculation_Type == 2) {

            D = (iClose(NULL, timeFrame, i) - iOpen(NULL, timeFrame, i+1));

         }

/*         // Experiment of the logical trader book ACD signal
         P = (iHigh(NULL, PERIOD_D1, i+1) + iLow(NULL, PERIOD_D1, i+1) + iClose(NULL, PERIOD_D1, i+1)) / 3;
         R = (iHigh(NULL, PERIOD_D1, i+1) + iLow(NULL, PERIOD_D1, i+1)) / 2;
         PRU = P+(MathAbs(P-R));
         PRD = P-(MathAbs(P-R));

         if (iOpen(NULL, PERIOD_D1, i+1) <= PRU && iClose(NULL, PERIOD_D1, i+1) > PRU) {

            LastValueUp[i] = 2;

         } else if (iOpen(NULL, PERIOD_D1, i+1) >= PRD && iClose(NULL, PERIOD_D1, i+1) < PRD) {

            LastValueUp[i] = -2;

         } else {

            LastValueUp[i] = 0;

         }
*/

         if (SumMode == 0) {

            LastValue[i] = D;

         } else {

            if (D > 0) {

               LastValue[i] = 1;

            } else {

               LastValue[i] = -1;

            }


         }

         int period = 0;

         if (SumPeriod > ArraySize(LastValue)) {

            period = ArraySize(LastValue);

         } else {

            period = SumPeriod;

         }

         for(int idx=0; idx<period; idx++) {

            sum += LastValue[i+idx];

         }

         SumValue[i] = sum;

         HSum[i] = SumValue[ArrayMaximum(SumValue, SumPeriod*8, 0)];
         LSum[i] = SumValue[ArrayMinimum(SumValue, SumPeriod*8, 0)];

         if (SumValue[i] >= 8) {

            HCount[i] = HCount[i+1] + 1;

         } else {

            HCount[i] = 0.0;

         }
         if (SumValue[i] <= -8) {

            LCount[i] = LCount[i+1] + 1;

         } else {

            LCount[i] = 0.0;

         }

         if (LCount[i] <= -9 || HCount[i] >= 9) {

            Alert("Potential trend change on ", TimeToStr(Time[i], TIME_DATE));

         }

      }

      i--;

   }

   return(0);

}
//+------------------------------------------------------------------+
Comments