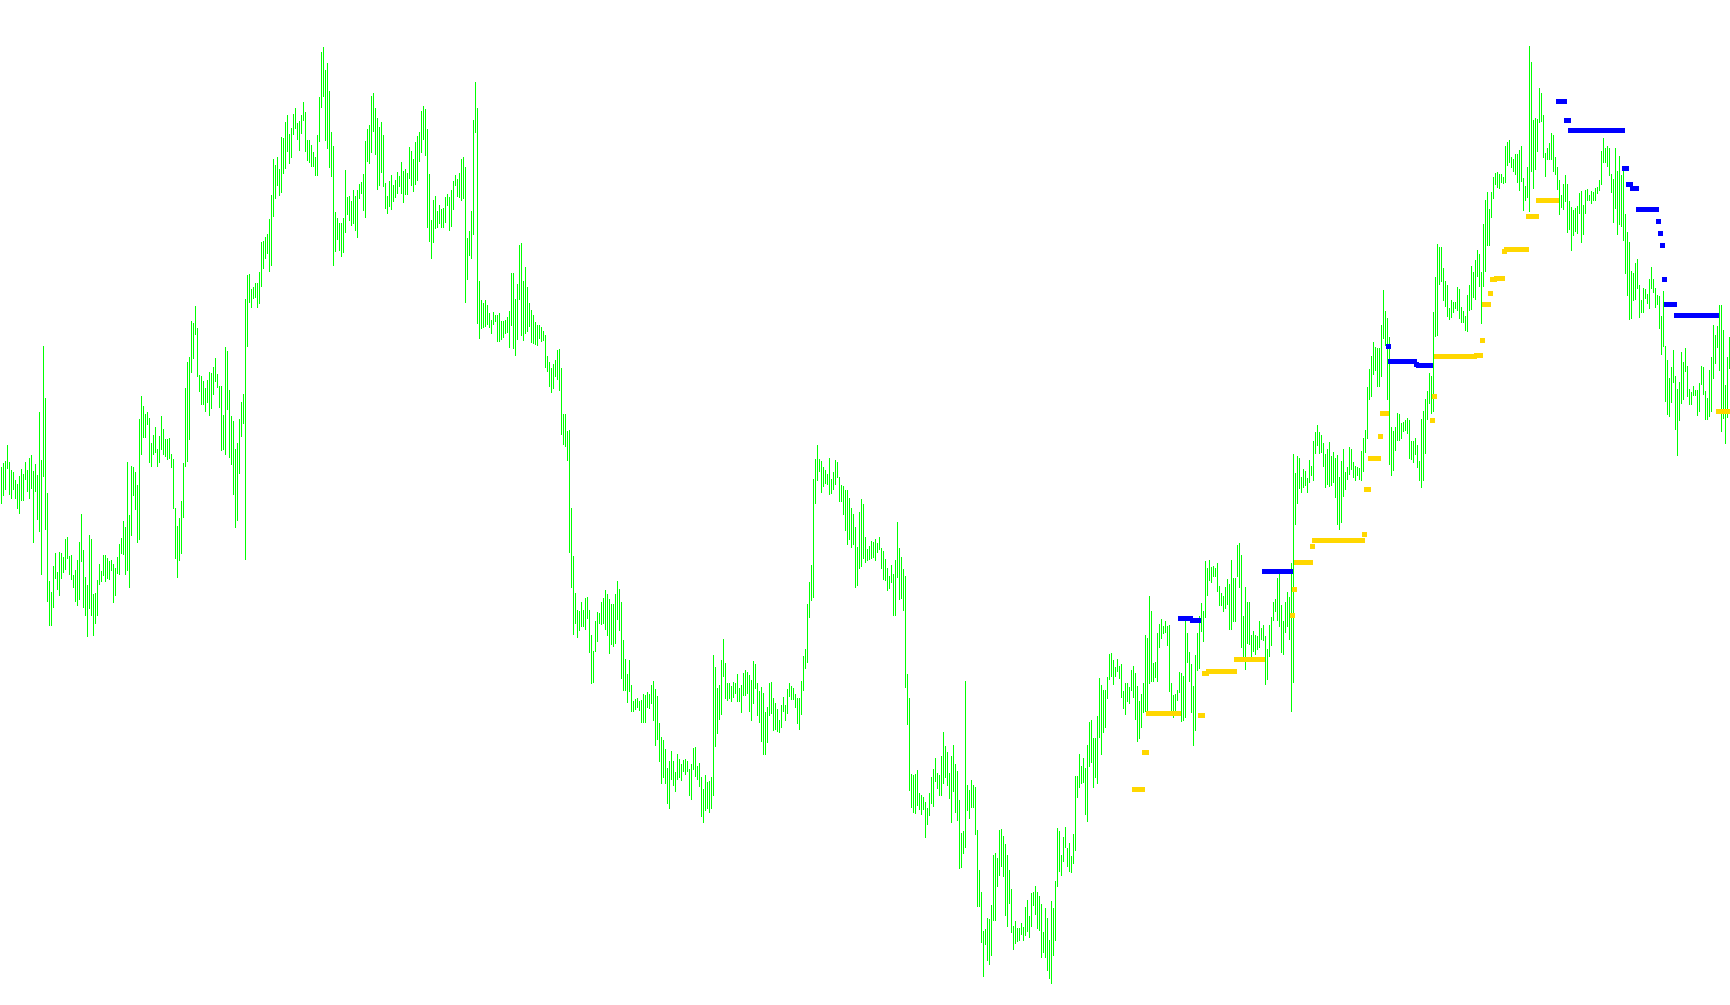
This script is designed as a custom technical indicator for the MetaTrader 4 platform. Its primary purpose is to identify and visualize market trends by analyzing price movements and volatility over a specific period. Instead of traditional moving averages, it uses a unique calculation method to determine when the "momentum" of a trend is shifting.
Core Logic and Functionality
1. Volatility Calculation (The WATR Component) The script begins by assessing how much the market is swinging. It looks back at a user-defined number of candles (the "Average Period") to calculate a weighted average of the price range (the difference between the highest high and the lowest low).
- Weighting: Rather than treating every candle equally, it applies a weighting factor that gives more significance to recent price action.
- Normalization: The script includes specific logic to handle different currency pairs (such as JPY crosses), ensuring that the volatility measurement is scaled correctly depending on which market you are trading.
2. Trend Detection and "Price Trailing" The tool tracks whether the current market direction is bullish (upward) or bearish (downward). It monitors the closing prices to establish a "trend state."
- If the price moves higher than the previous established peak in an uptrend, the script updates that peak.
- It constantly calculates a "threshold" based on the current volatility. If the market price drops below this volatility-adjusted threshold, the script recognizes that the upward momentum has broken and flips the trend to bearish.
- The reverse logic applies to downtrends: it tracks new lows and flips the trend to bullish if the price rises above the volatility-adjusted floor.
3. Visual Representation The indicator communicates these findings directly on your trading chart using two distinct visual markers (arrows):
- Bullish Signal: When the logic identifies an upward trend, it marks the data accordingly.
- Bearish Signal: When the logic identifies a downward trend, it switches to the second set of markers.
User Customization Options
The script allows for three different "Variants," which change how the volatility and history are calculated:
- Variant 1: Focuses on historical data from a specific point in the past (determined by the "CountBars" setting).
- Variant 2: Analyzes the most recent price action available on the chart.
- Variant 3: A dynamic calculation that recalculates the volatility range for every single bar it processes, providing a more reactive movement analysis.
In summary, this script acts as a "trend follower." It filters out minor market noise by using weighted volatility to decide if a price move is significant enough to represent a change in trend direction.
//+------------------------------------------------------------------+
//|                                                    NRTR WATR.mq4 |
//|                                                                  |
//|                                        Ramdass - Conversion only |
//+------------------------------------------------------------------+

#property indicator_chart_window
#property indicator_buffers 2
#property indicator_color1 Blue
#property indicator_color2 Red
//---- input parameters
extern int AveragePeriod=10;
extern int Variant=2;
extern int CountBars=300;

//---- buffers
double value1[];
double value2[];
//+------------------------------------------------------------------+
//| Custom indicator initialization function                         |
//+------------------------------------------------------------------+
int init()
  {

//---- indicator line
   IndicatorBuffers(2);
   SetIndexStyle(0,DRAW_ARROW);
   SetIndexArrow(0,167);
   SetIndexStyle(1,DRAW_ARROW);
   SetIndexArrow(1,167);
   SetIndexBuffer(0,value1);
   SetIndexBuffer(1,value2);
//----
//----
   return(0);
  }
//+------------------------------------------------------------------+
//| NRTR WATR                                                        |
//+------------------------------------------------------------------+
int start()
  {
   if (CountBars>=Bars) CountBars=Bars - AveragePeriod - 2;
//   CountBars = CountBars - AveragePeriod - 3;
   SetIndexDrawBegin(0,Bars-CountBars+1);
   SetIndexDrawBegin(1,Bars-CountBars+1);
   int i,i2,bar,counted_bars=IndicatorCounted();
   double value,WATR;
   double trend=1,dK,AvgRange,price,AveragePeriod_D;
   AveragePeriod_D=AveragePeriod;
//----
   if(Bars<=AveragePeriod) return(0);
//---- initial zero
   if(counted_bars<1)
   {
      for(i=1;i<=AveragePeriod;i++) value1[Bars-i]=0.0;
      for(i=1;i<=AveragePeriod;i++) value2[Bars-i]=0.0;
   }
AvgRange=0;

if ((Variant == 2) || (Variant == 3))
   {
   for (i=AveragePeriod; i>=1; i--)
       {
       dK = 1+(AveragePeriod_D-i)/AveragePeriod_D;
       AvgRange=AvgRange + dK*MathAbs(High[i]-Low[i]);
       }
   if (Symbol()=="USDJPY" || Symbol()=="GBPJPY" || Symbol()=="EURJPY")
   {WATR = AvgRange/AveragePeriod_D/100;}
   else
   {WATR = AvgRange/AveragePeriod_D;}
   }


if (Variant == 1)
   {
   for (i=1; i<=AveragePeriod; i++)
       {
       dK = 1+(AveragePeriod_D-i)/AveragePeriod_D;
       AvgRange=AvgRange + dK*MathAbs(High[CountBars + i]-Low[CountBars + i]);
       }
   WATR = AvgRange/AveragePeriod_D;
   }

if (Close[CountBars-1] > Open[CountBars-1])
   {
   value1[CountBars - 1] = Close[CountBars - 1] * (1 - WATR);
   trend = 1; value2[CountBars - 1] = 0.0;
   }

if (Close[CountBars-1] < Open[CountBars-1])
   {
   value2[CountBars - 1] = Close[CountBars - 1] * (1 + WATR);
   trend = -1; value1[CountBars - 1] = 0.0;
   }

//----
   bar=CountBars;
   while(bar>=0)
     {
value1[bar]=0.0; value2[bar]=0.0;

    if (Variant == 3)
    {
        AvgRange=0;
        for (i=1; i<=AveragePeriod; i++)
            {
            dK = 1+(AveragePeriod_D-i)/AveragePeriod_D;
            AvgRange=AvgRange+ dK*MathAbs(High[bar + i]-Low[bar + i]);
            }
        WATR = AvgRange/AveragePeriod_D;
    }
    if (trend == 1)
      {
       if (Close[bar] > price) price = Close[bar];
       value = price * (1 - WATR);
       if (Close[bar] < value)
         {
          price = Close[bar];
          value = price * (1 + WATR);
          trend = -1;
          }
       }
    if (trend == -1)
      {
       if (Close[bar] < price) price = Close[bar];
       value = price * (1 + WATR);
       if (Close[bar] > value)
          {
          price = Close[bar];
          value = price * (1 - WATR);
          trend = 1;
          }
       }

if (trend == 1)  {value1[bar]=value; value2[bar]=0.0;}
if (trend == -1)  {value2[bar]=value; value1[bar]=0.0;}

      bar--;
     }
   return(0);
  }
//+------------------------------------------------------------------+
Comments