s Indicator [i]
Download script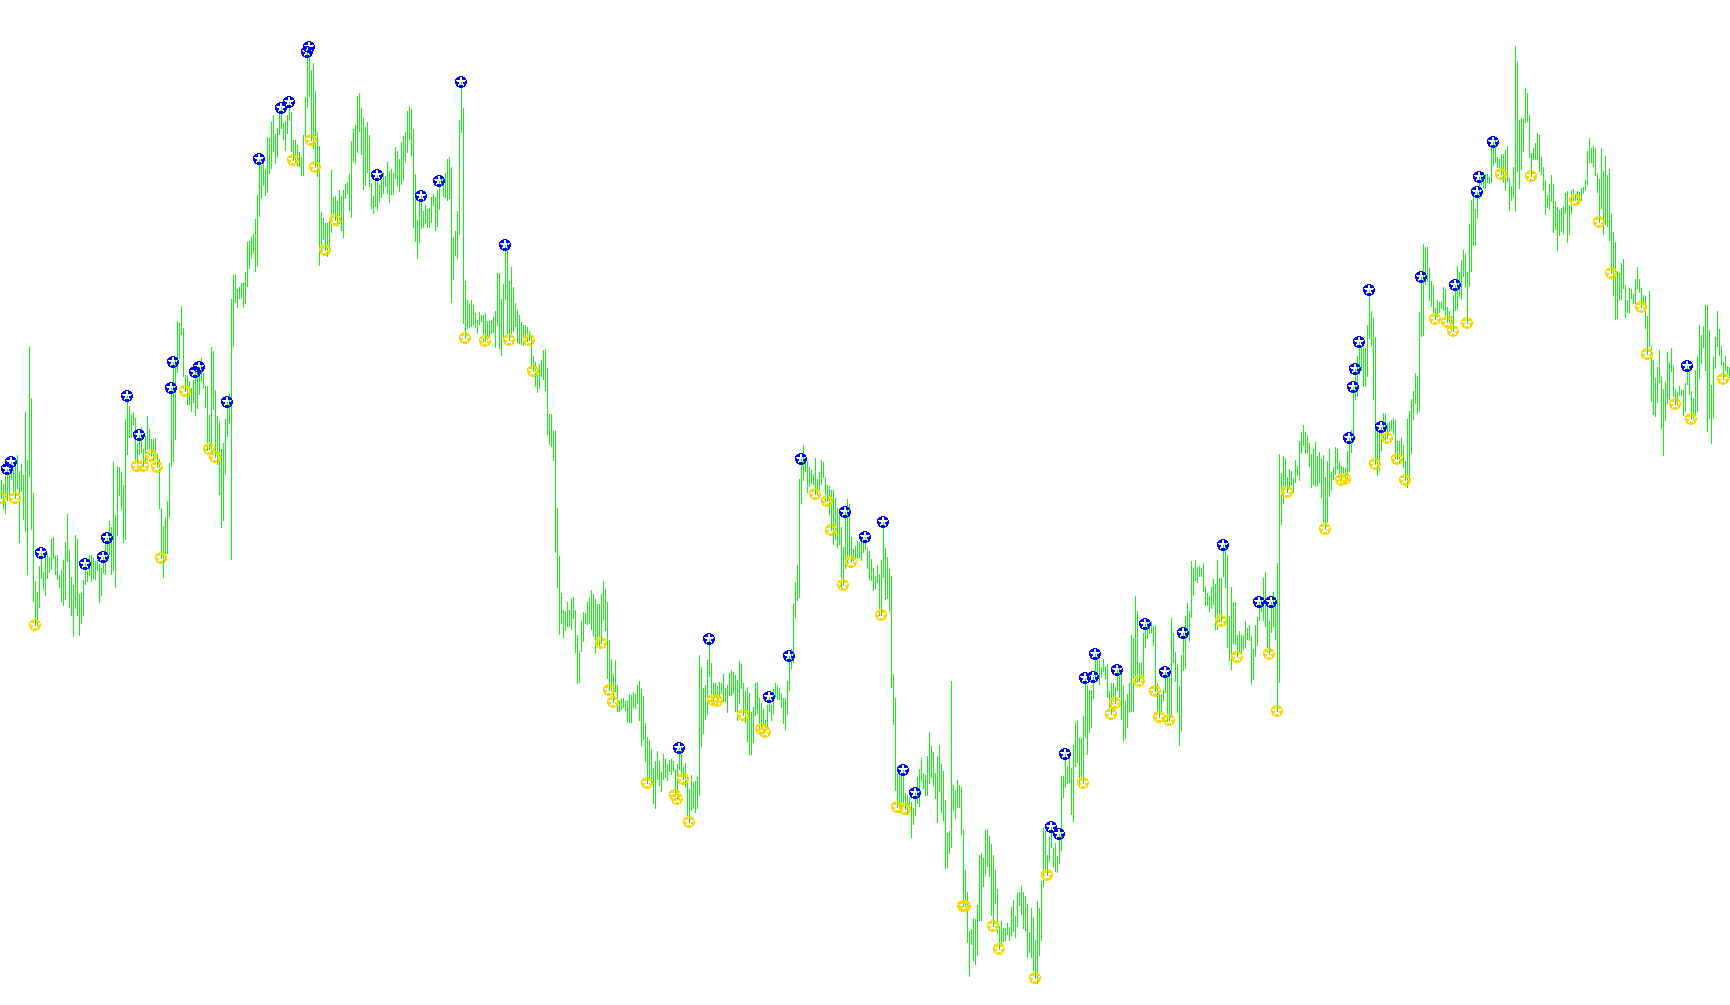
This script is a technical analysis tool designed to identify specific price action patterns on a trading chart. It functions by scanning historical price data to spot "reversal" or "breakout" signals based on where the price opens and closes relative to its total price range.
The logic operates in two distinct modes, which you can switch between depending on your trading strategy:
Variation 0: Price Range Displacement
In this mode, the tool looks for significant "stretches" in price movement from one candle to the next. It measures the total height of a completed candle and divides that space into sections.
- Buy Signals: If a previous candle opens at the very top of its range (the upper 20%) but manages to close at the very bottom (the lower 20%), it suggests an aggressive move downward that might be exhausted. The tool then marks a potential buy point if the current price dips slightly below that previous low.
- Sell Signals: Conversely, if a candle opens at the bottom of its range but closes at the top, it indicates a strong upward push. The tool marks a potential sell point if the price rises slightly above that previous high.
Essentially, this mode identifies instances where the price moved "too far, too fast" in one direction and looks for an entry point on a potential retracement.
Variation 1: Inside Bar Consolidation
This mode is more restrictive and looks for signs of market exhaustion or "coiling" before a breakout. It requires three specific conditions to be met:
- The Shrinking Range: The most recent completed candle must be an "Inside Bar"—meaning it is smaller than the three candles preceding it. This suggests that market volatility is decreasing and the price is consolidating.
- The Setup: It specifically looks for this consolidation to happen after a period of higher activity.
- The Trigger: Once this small, consolidated bar is identified, the tool monitors the current live candle.
- If the current price opens in the bottom 20% of that small bar's range, it triggers a Buy signal.
- If the current price opens in the top 20% of that small bar's range, it triggers a Sell signal.
Visual Output
Regardless of which Variation you choose, the script provides clear visual feedback on your chart. It places arrows at specific price points to highlight exactly where these conditions have been met, allowing you to see historical signals and monitor live movements in real-time.
//+------------------------------------------------------------------+
//|                                                   The 20's v0.20 |
//+------------------------------------------------------------------+
#property copyright "Copyright © 2005, TraderSeven"
#property link      "TraderSeven@gmx.net"

//            \\|//             +-+-+-+-+-+-+-+-+-+-+-+             \\|//
//           ( o o )            |T|r|a|d|e|r|S|e|v|e|n|            ( o o )
//    ~~~~oOOo~(_)~oOOo~~~~     +-+-+-+-+-+-+-+-+-+-+-+     ~~~~oOOo~(_)~oOOo~~~~
// This EA has 2 main parts.
// Variation=0
// If previous bar opens in the lower 20% of its range and closes in the upper 20% of its range then sell on previous high+10pips.
// If previous bar opens in the upper 20% of its range and closes in the lower 20% of its range then buy on previous low-10pips.
//
// Variation=1
// The previous bar is an inside bar that has a smaller range than the 3 bars before it.
// If todays bar opens in the lower 20% of yesterdays range then buy.
// If todays bar opens in the upper 20% of yesterdays range then sell.
//
//01010100 01110010 01100001 01100100 01100101 01110010 01010011 01100101 01110110 01100101 01101110

#property indicator_chart_window
#property indicator_buffers 2
#property indicator_color1 Blue
#property indicator_color2 Red

extern int Variation=0;

double The20sBufferBuy[];
double The20sBufferSell[];

int init()
{
   IndicatorBuffers(2);

   SetIndexStyle(0,DRAW_ARROW);
   SetIndexStyle(1,DRAW_ARROW);
   SetIndexBuffer(0,The20sBufferBuy);
   SetIndexBuffer(1,The20sBufferSell);
   SetIndexArrow(0,181);
   SetIndexArrow(1,181);
   SetIndexEmptyValue(0,0.0);
   SetIndexEmptyValue(1,0.0);
   ArraySetAsSeries(The20sBufferBuy,true);
   ArraySetAsSeries(The20sBufferSell,true);
   IndicatorShortName("The20s("+Variation+")");

   return(0);
}

int deinit()
{
   return(0);
}

int start()
{
   int i,TotalBars, CountedBars;
   double LastBarsRange,Top20,Bottom20;

   CountedBars=IndicatorCounted();     // Find the number of bars on the screen since
                                       //    this indicator/expert was first executed
                                       //    on the current chart
   if(CountedBars < 0)                 // If there are less than 0 bars of data, we
      return (-1);                     //    have a problem

   if(CountedBars > 0)
      CountedBars--;

   TotalBars=Bars-CountedBars;

   for(i=TotalBars-1;i>=0;i--)
   {
      LastBarsRange=(High[i+1]-Low[i+1]);
      Top20=High[i+1]-(LastBarsRange*0.20);
      Bottom20=Low[i+1]+(LastBarsRange*0.20);

      if(Variation==0)
      {
         if(Open[i+1]>=Top20 && Close[i+1]<=Bottom20 && Low[i]<=Low[i+1]+10*Point)
            The20sBufferBuy[i]=Low[i];
         else if(Open[i+1]<=Bottom20 && Close[i+1]>=Top20 && High[i]>=High[i+1]+10*Point)
            The20sBufferSell[i]=High[i];
      }
      else if(Variation==1)
      {
         if((High[i+4]-Low[i+4])>LastBarsRange && (High[i+3]-Low[i+3])>LastBarsRange && (High[i+2]-Low[i+2])>LastBarsRange && High[i+2]>High[i+1] && Low[i+2]<Low[i+1])
         {
            if(Open[i]<=Bottom20)
               The20sBufferBuy[i]=Low[i];
            if(Open[i]>=Top20)
               The20sBufferSell[i]=High[i];
         }
      }
   }
}
Comments