Schaff Trend Cycle
Download script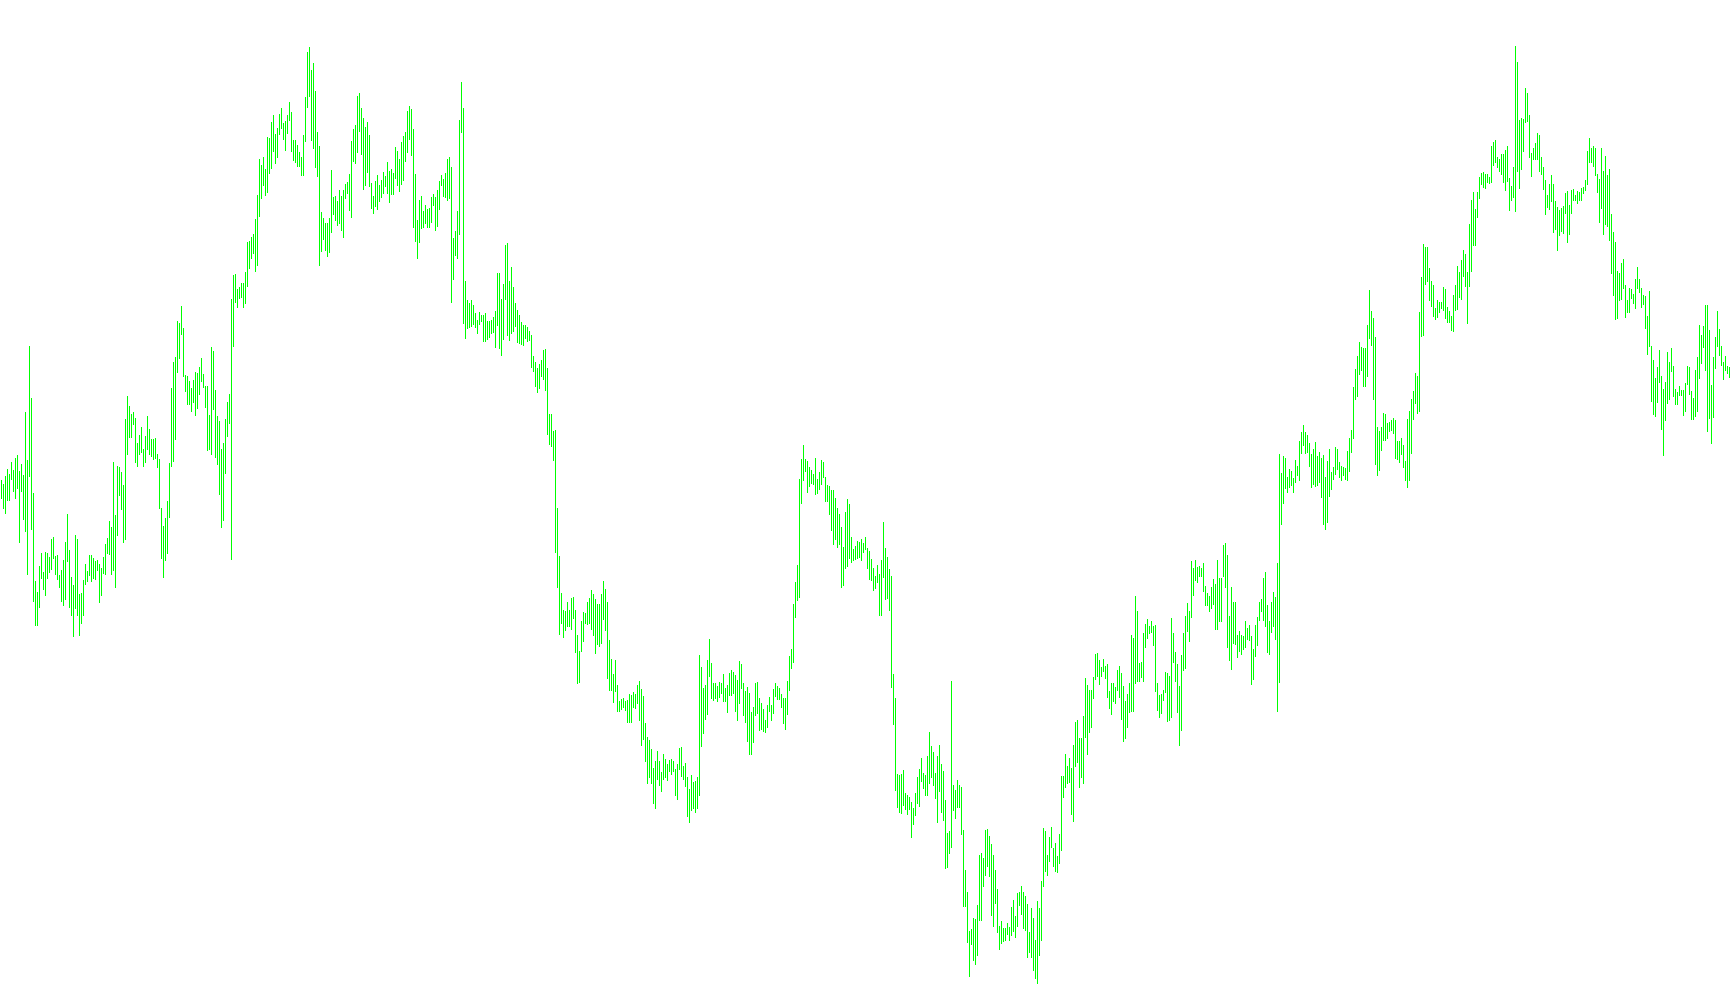
This script is designed to provide traders with a visual representation of market momentum and trend cycles by processing price data into a smooth, oscillating line. Rather than looking at raw price movements directly, the logic focuses on identifying the relationship between different timeframes to reveal underlying trends.
Core Analytical Process
The tool operates through a multi-step transformation process:
1. Momentum Calculation (MACD Base) The script begins by calculating two separate exponential moving averages: a "Short" average and a "Long" average. By subtracting the long average from the short average, the script determines the current momentum of the market. This tells the system whether the price is accelerating upward, downward, or staying flat.
2. Cycle Identification Instead of showing this momentum continuously, the script groups these movements into specific "cycles" (defined by a user-set parameter). It looks at each cycle to identify its highest peak and its lowest valley. This allows the tool to understand the relative "swing" of the market over a specific period.
3. Normalization (The Percentage Scale) Once a cycle's high and low points are identified, the script calculates where the current momentum sits within that range as a percentage. This "normalizes" the data, converting volatile price movements into a consistent scale (typically between 0 and 100). This makes it much easier for a trader to see the strength of a trend regardless of how high or low the actual asset price is trading.
4. Smoothing for Readability To prevent the resulting line from being too erratic or "noisy" for human observation, the script applies a final smoothing filter. It compares the current value with the previous value and blends them together. This creates a fluid, curved motion that highlights the primary trend cycle while filtering out minor, insignificant price flickers.
Summary of Visual Behavior
The end result is a smooth line displayed in a separate window below your main chart. It behaves as a trend oscillator:
- When the line moves upward, it indicates increasing bullish momentum relative to its recent cycle.
- When the line moves downward, it indicates increasing bearish momentum.
- The smoothness of the line ensures that traders can identify major shifts in market "mood" or cycles without being distracted by momentary price volatility.
//+------------------------------------------------------------------+
//|                                          Schaff Trend Cycle.mq4  |
//|                                       Ramdass - Conversion only  |
//+------------------------------------------------------------------+
#property  copyright "Copyright © 2004, FostarFX."
#property  link      "mail: fostar_fx@yahoo.com"
//----
#property indicator_separate_window
#property indicator_minimum -10
#property indicator_maximum 110
#property indicator_buffers 1
#property indicator_color1 DarkOrchid
//---- input parameters
extern int MAShort=23;
extern int MALong=50;
extern double Cycle=10;
extern int CountBars=300;
//---- buffers
double MA[];
double ST[];
//+------------------------------------------------------------------+
//| Custom indicator initialization function                         |
//+------------------------------------------------------------------+
int init()
  {
   //   string short_name;
//---- indicator line
   IndicatorBuffers(2);
   SetIndexBuffer(0, MA);
   SetIndexBuffer(1, ST);
   SetIndexStyle(0,DRAW_LINE,STYLE_SOLID,2,DarkOrchid);
//----
//----
   return(0);
  }
//+------------------------------------------------------------------+
//| Schaff Trend Cycle                                               |
//+------------------------------------------------------------------+
int start()
  {
   SetIndexDrawBegin(0,Bars-CountBars+MALong+MAShort+1);
   int shift,u,counted_bars=IndicatorCounted();
   double MCD, LLV, HHV, MA_Short, MA_Long, sum ,prev, smconst;
   int n, i, s;
   bool check_begin=false, check_begin_MA=false;
   double MCD_Arr[100];
//----
   if(Bars<=MALong) return(0);
   if (CountBars==0) CountBars=Bars;
//---- initial zero
   if(counted_bars<MALong+MAShort)
     {
      for(i=1;i<=MALong;i++) MA[Bars-i]=0.0;
      for(i=1;i<=MALong;i++) ST[Bars-i]=0.0;
     }
//----
   shift=CountBars-MALong-1;
   //   if(counted_bars>=MALong) shift=Bars-counted_bars-1;
//----
   check_begin=false;
   check_begin_MA=false;
   n=1;
   s=1;
   smconst=2/(1 + Cycle/2);
//----
   while(shift>=0)
     {
      MA_Short=iMA(NULL,0,MAShort,0, MODE_EMA, PRICE_TYPICAL, shift);
      MA_Long=iMA(NULL,0,MALong,0, MODE_EMA, PRICE_TYPICAL, shift);
      MCD_Arr[n]=MA_Short - MA_Long;
      MCD=MA_Short - MA_Long;
//----
      if (n>=Cycle)
        {
        n=1; check_begin=true;
        }
        else {n=n + 1;}
      if (check_begin)
        {
         for(i=1; i<=Cycle; i++)
           {
            if (i==1) {LLV=MCD_Arr[i];}
              else
              {
               if (LLV > MCD_Arr[i]) LLV=MCD_Arr[i];
              }
            if (i==1) {HHV=MCD_Arr[i];}
              else
              {
               if (HHV < MCD_Arr[i]) HHV=MCD_Arr[i];
              }
           }
         ST[shift]=((MCD - LLV)/(HHV - LLV))*100 + 0.01;
         s=s + 1;
         if (s>=(Cycle)/2)
           {
            s=1;
            check_begin_MA=true;
           }
        }
         else {ST[shift]=0;
        }
        if (check_begin_MA)
        {
         prev=MA[shift + 1];
        MA[shift]=smconst * (ST[shift] - prev) + prev;
        }
      shift--;
     }
   return(0);
  }
//+------------------------------------------------------------------+
Comments