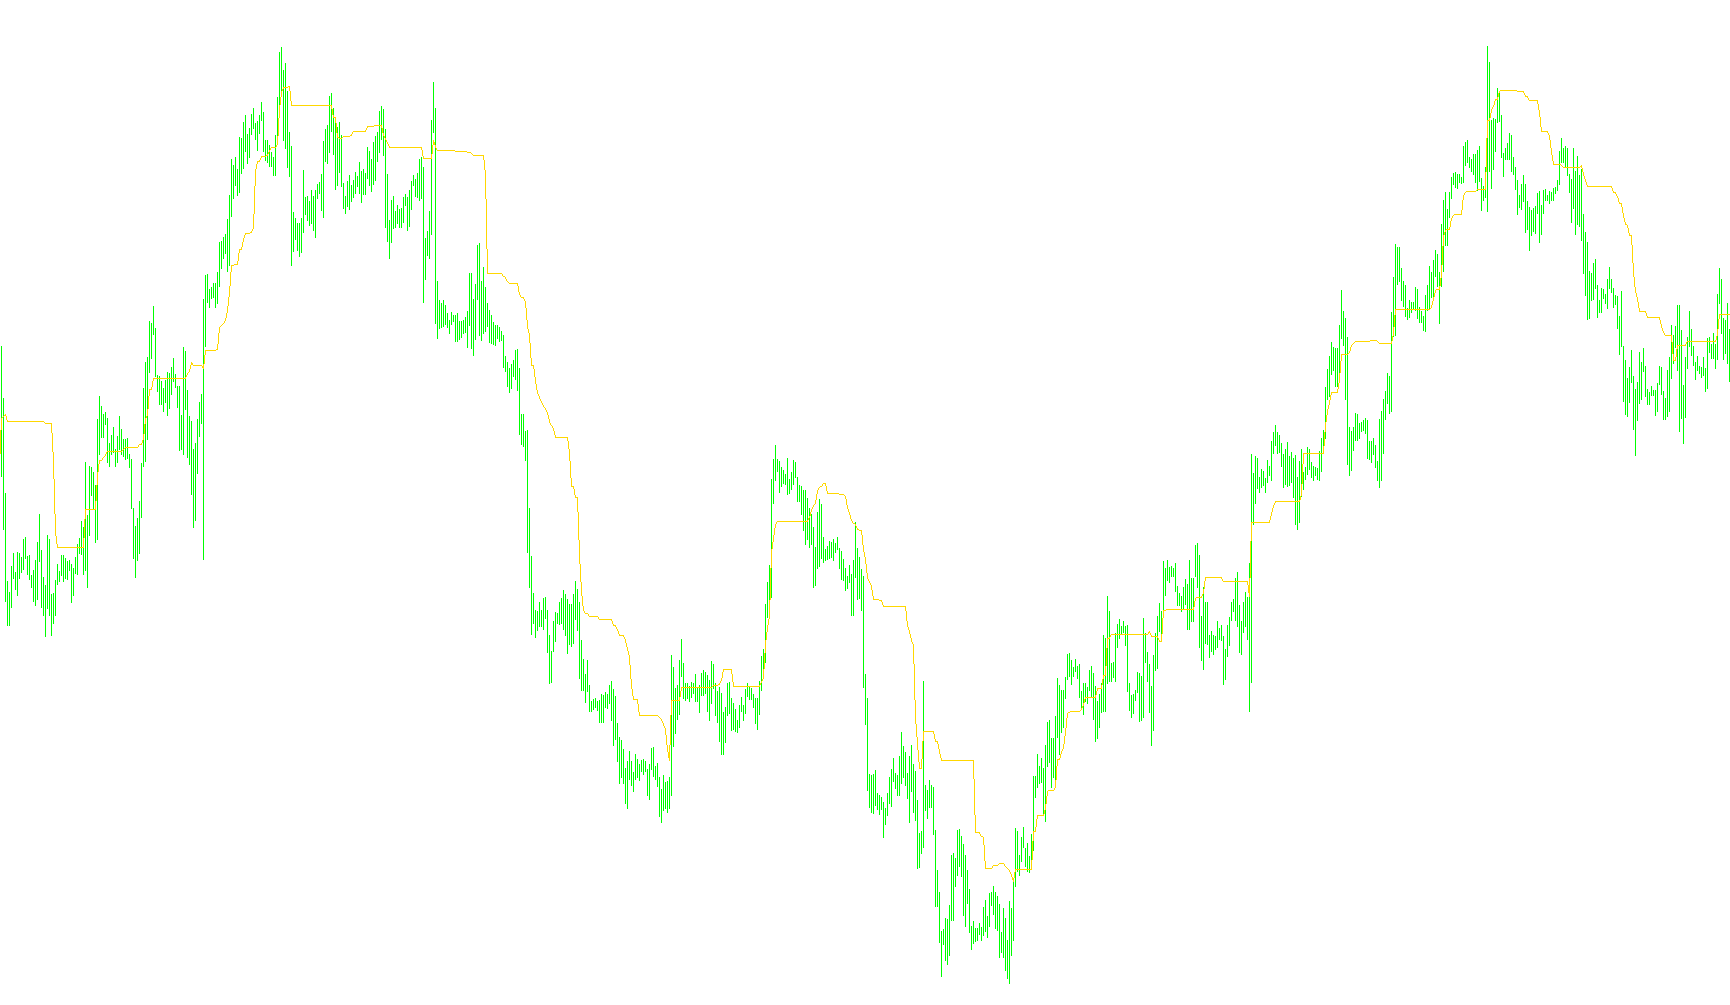
This tool is designed to provide a visual trend analysis by identifying key price levels based on historical market movement. Instead of following every minor fluctuation in price, it focuses on calculating a specific "equilibrium" point over a set period of time.
How the Logic Works
The indicator operates by looking back at a specific window of recent candles (defined by the "SSP" parameter). For every point on the chart, it scans this entire lookback period to find two critical values:
- The highest price reached during that timeframe.
- The lowest price reached during that timeframe.
Once it identifies these extremes, it calculates the total range of the market movement (the difference between the high and the low). It then determines a specific percentage point within that range—defined by the "SSK" setting—to establish a baseline value.
Visual Representation and Smoothing
To make this data useful for traders, the script performs three main actions:
- The Equilibrium Line: It plots these calculated points as a continuous line on your chart. This helps in identifying where the "center of gravity" for the price is currently located.
- Time Shifting: The tool incorporates a "Shift" feature. This moves the calculated line forward on the chart, which helps in smoothing out the visual data and can provide a clearer picture of the current trend direction by reducing immediate noise.
- Dynamic Updating: The logic continuously recalculates as new candles form, ensuring that the baseline evolves as the market moves from one price range to another.
Summary for the User
Essentially, this script acts as a "trend filter." By highlighting a specific percentage of the high-low range over a set number of candles, it allows you to see whether the current price is trading above or below a significant historical benchmark. It is intended to help you visualize the broader market structure rather than reacting to every small tick in price.
//+------------------------------------------------------------------+
//|                                                    Kijun-sen.mq4 |
//|                                     Copyright © 2004, AlexSilver |
//|                                                  http://viac.ru/ |
//+------------------------------------------------------------------+
#property copyright "Copyright © 2004, AlexSilver"
#property link      "http://viac.ru/"

#property indicator_chart_window
#property indicator_buffers 1
#property indicator_color1 DeepSkyBlue
//---- input parameters
extern int SSP=26;
extern int ShiftP=6;
extern double SSK=73.4;
//---- buffers
double SSP_Buffer[];
//----
int a_begin;
//+------------------------------------------------------------------+
//| Custom indicator initialization function                         |
//+------------------------------------------------------------------+
int init()
  {
//----
   SetIndexStyle(0,DRAW_LINE);
   SetIndexBuffer(0,SSP_Buffer);
   SetIndexDrawBegin(0,SSP+ShiftP-1);
   SetIndexShift(0,ShiftP);
   SetIndexLabel(0,"Silver-Sen");
//----
   return(0);
  }
//+------------------------------------------------------------------+
//| Silver-sen                                                       |
//+------------------------------------------------------------------+
int start()
  {
   int    i,k;
   int    counted_bars=IndicatorCounted();
   double high,low,price;
//----
   if(Bars<=SSP) return(0);
//---- initial zero
   if(counted_bars<1)
     {
      for(i=1;i<=SSP;i++)     SSP_Buffer[Bars-i]=0;
     }
//---- Silver Sen
   i=Bars-SSP;
   if(counted_bars>SSP) i=Bars-counted_bars-1;
   while(i>=0)
     {
      high=High[i]; low=Low[i]; k=i-1+SSP;
      while(k>=i)
        {
         price=High[k];
         if(high<price) high=price;
         price=Low[k];
         if(low>price)  low=price;
         k--;
        }
      SSP_Buffer[i+ShiftP]=low+(high-low)*SSK/100;
      i--;
     } i=ShiftP-1;
   while(i>=0)
     {
      high=High[0]; low=Low[0]; k=SSP-ShiftP+i;
      while(k>=0)
        {
         price=High[k];
         if(high<price) high=price;
         price=Low[k];
         if(low>price)  low=price;
         k--;
        }
      SSP_Buffer[i]=low+(high-low)*SSK/100;
      i--;
     }
   }
//+------------------------------------------------------------------+
Comments