SMI_v2
Download script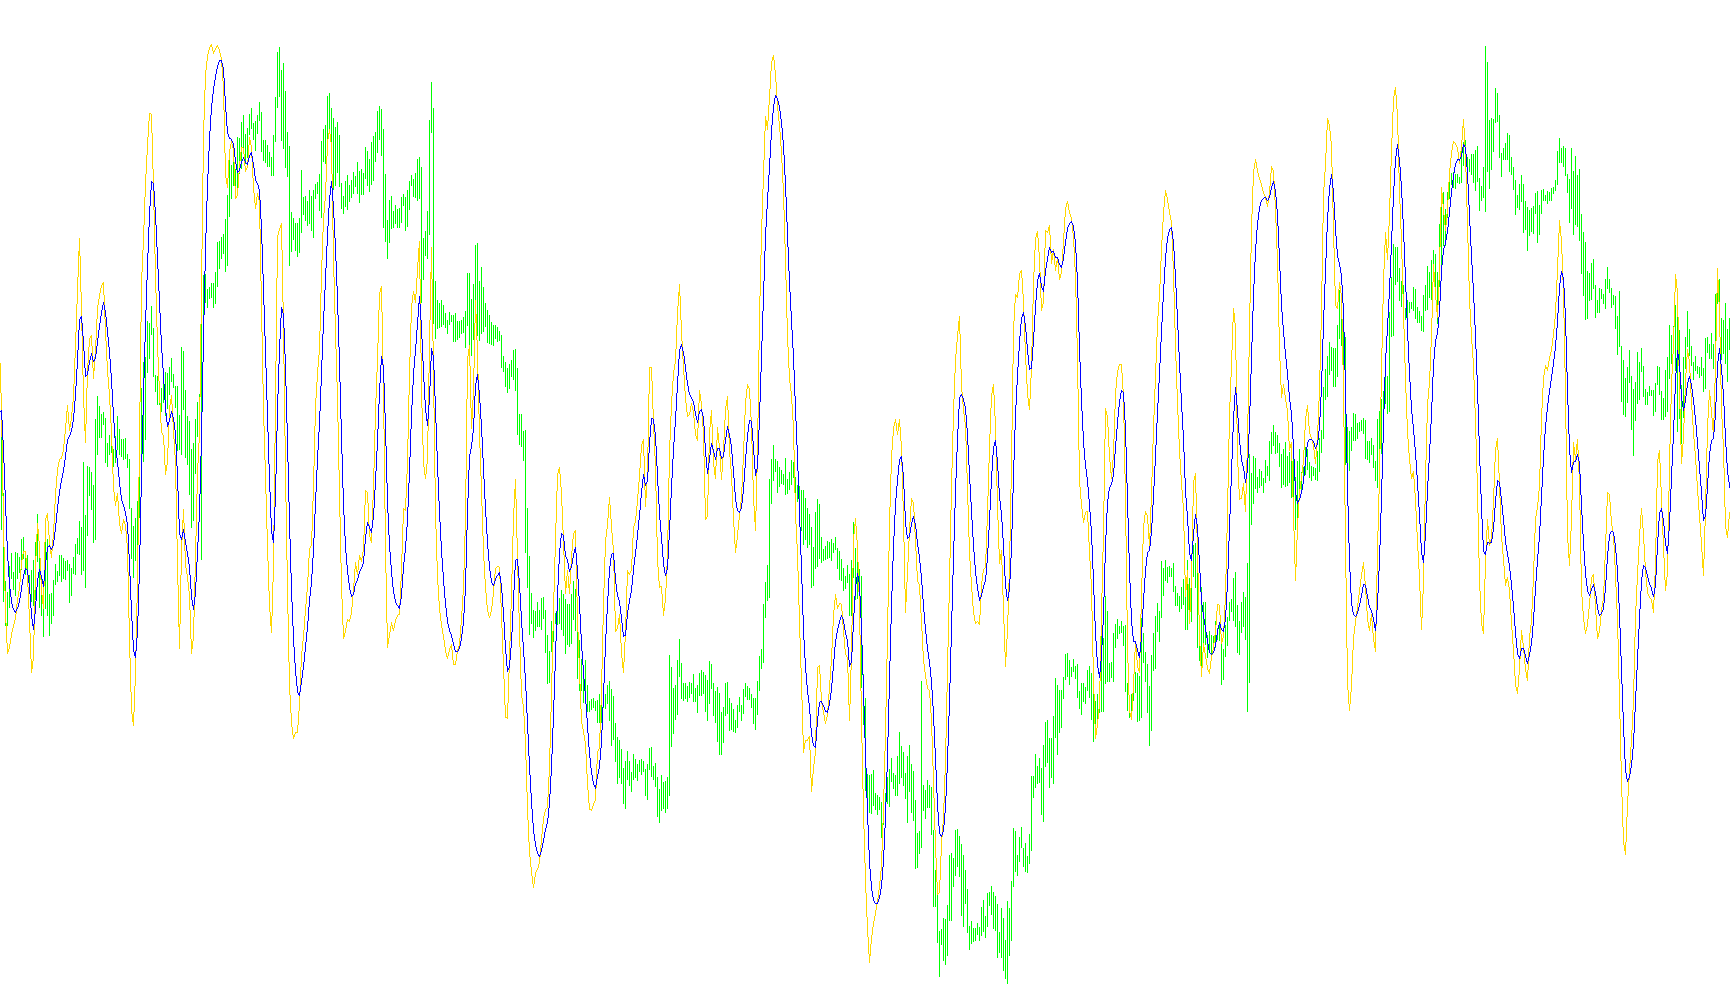
This technical script is designed as a momentum-based trading indicator for the MetaTrader platform. Its primary purpose is to visualize price strength and momentum by comparing current market movements against historical volatility and averages.
How the Logic Works
The tool operates through a multi-layered calculation process that filters out market "noise" to reveal underlying trends. Here is the step-by-step breakdown of how it processes data:
1. Establishing the Baseline (Volatility and Midpoints) First, the script looks at a specific window of recent price action to identify two key components:
- Range: It calculates the difference between the highest high and the lowest low within a set period. This represents the "volatility" or the total space the market has moved in recently.
- Midpoint: It determines the center point between those highs and lows, creating a balanced baseline of where the price is currently sitting relative to its recent boundaries.
2. Relative Positioning The script then calculates the distance between the current closing price and that midpoint. This tells the tool whether the price is currently "leaning" toward the high side or the low side of its recent range.
3. Smoothing the Data (Moving Averages) Raw market data can be erratic. To make the information readable, the script applies several layers of Exponential Moving Averages (EMA). It smooths both the volatility data and the relative positioning data multiple times. This ensures that minor, insignificant price fluctuations do not cause the indicator to react wildly, focusing instead on sustained momentum.
4. Calculating the SMI Value The core logic culminates in the calculation of the SMI (Stochastic Momentum Index) value. It takes the smoothed "positioning" data and divides it by the smoothed "volatility" data. This result is then scaled to a percentage-like format (multiplied by 100). By doing this, the indicator shows you how much momentum there is relative to the market's overall range.
5. The Signal Line Finally, the script generates a secondary "Signal Line." This is a smoothed version of the SMI itself. Traders typically look at the relationship between the main SMI line and this Signal line; when the two lines cross or diverge significantly, it can indicate a potential shift in market momentum.
Summary for the User
In simple terms, this indicator tells you how fast and in what direction the price is moving compared to its recent historical range. By smoothing out the "jitter" of the market, it helps you identify whether the current trend has enough strength to continue or if it is starting to lose steam.
/*-----------------------------+
|			       |
| Shared by www.Aptrafx.com    |
|			       |
+------------------------------*/

//+------------------------------------------------------------------+
//|                                                          SMI.mq4 |
//|                      Copyright © 2005, MetaQuotes Software Corp. |
//|                                        http://www.metaquotes.net |
//+------------------------------------------------------------------+
#property copyright "Copyright © 2005, MetaQuotes Software Corp."
#property link      "http://www.metaquotes.net"

#property indicator_separate_window
#property indicator_buffers 2
#property indicator_color1 White
#property indicator_color2 Red
#property indicator_level1 0
//---- input parameters
extern int       Period_Q=2;
extern int       Period_R=8;
extern int       Period_S=5;
extern int       Signal=5;
//---- buffers
double SMI_Buffer[];
double Signal_Buffer[];
double SM_Buffer[];
double EMA_SM[];
double EMA2_SM[];
double EMA_HQ[];
double EMA2_HQ[];
double HQ_Buffer[];
//+------------------------------------------------------------------+
//| Custom indicator initialization function                         |
//+------------------------------------------------------------------+
int init()
  {
//---- indicators
   IndicatorBuffers(8);
   SetIndexStyle(0,DRAW_LINE);
   SetIndexBuffer(0,SMI_Buffer);
   SetIndexStyle(1,DRAW_LINE);
   SetIndexBuffer(1,Signal_Buffer);
   SetIndexLabel(0,"SMI");
   SetIndexLabel(1,"Signal SMI");
   SetIndexBuffer(2,SM_Buffer);
   SetIndexBuffer(3,EMA_SM);
   SetIndexBuffer(4,EMA2_SM);
   SetIndexBuffer(5,EMA_HQ);
   SetIndexBuffer(6,EMA2_HQ);
   SetIndexBuffer(7,HQ_Buffer);

   IndicatorShortName("SMI("+Period_Q+","+Period_R+","+Period_S+","+Signal+")");
//----
   return(0);
  }
//+------------------------------------------------------------------+
//| Custor indicator deinitialization function                       |
//+------------------------------------------------------------------+
int deinit()
  {
//---- TODO: add your code here

//----
   return(0);
  }
//+------------------------------------------------------------------+
//| Custom indicator iteration function                              |
//+------------------------------------------------------------------+
int start()
  {
   int    counted_bars=IndicatorCounted();
   int limit;
   int i;
//   double Median_Q[];
   if(counted_bars<0) return(-1);
   if(counted_bars>0) counted_bars--;
   limit=Bars-Period_Q-counted_bars;
   if(counted_bars>0) counted_bars--;
//   ArrayResize(Median_Q,limit);
//   ArrayResize(HQ_Buffer,limit);
//   ArraySetAsSeries(Median_Q,true);
//   ArraySetAsSeries(HQ_Buffer,true);
   for (i=limit;i>=0;i--)
      {
      //Median_Q[i]=(High[Highest(NULL,0,MODE_HIGH,0,i)]+Low[Lowest(NULL,0,MODE_HIGH,0,i)])/2;
      HQ_Buffer[i]=High[Highest(NULL,0,MODE_HIGH,Period_Q,i)]-Low[Lowest(NULL,0,MODE_LOW,Period_Q,i)];
      SM_Buffer[i]=Close[i]-(High[Highest(NULL,0,MODE_HIGH,Period_Q,i)]+Low[Lowest(NULL,0,MODE_LOW,Period_Q,i)])/2;//Median_Q[i];
      }
//   for (i=limit;i>=0;i--)
//      {
//      SM_Buffer[i]=Close[i]-(High[Highest(NULL,0,MODE_HIGH,0,i)]+Low[Lowest(NULL,0,MODE_HIGH,0,i)])/2;//Median_Q[i];
//      }
   for (i=limit-Period_R;i>=0;i--)
      {
      EMA_SM[i]=iMAOnArray(SM_Buffer,0,Period_R,0,MODE_EMA,i);
      EMA_HQ[i]=iMAOnArray(HQ_Buffer,0,Period_R,0,MODE_EMA,i);
      }
   for (i=limit-Period_R-Period_S;i>=0;i--)
      {
      EMA2_SM[i]=iMAOnArray(EMA_SM,0,Period_S,0,MODE_EMA,i);
      EMA2_HQ[i]=iMAOnArray(EMA_HQ,0,Period_S,0,MODE_EMA,i);
      }
   for (i=limit-Period_R-Period_S-Signal;i>=0;i--)
      {
      SMI_Buffer[i]=100*EMA2_SM[i]/0.5/EMA2_HQ[i];
      }
   for (i=limit-Period_R-Period_S;i>=0;i--)
      {
      Signal_Buffer[i]=iMAOnArray(SMI_Buffer,0,Signal,0,MODE_EMA,i);
      }

//---- TODO: add your code here

//----
   return(0);
  }
//+------------------------------------------------------------------+
Comments