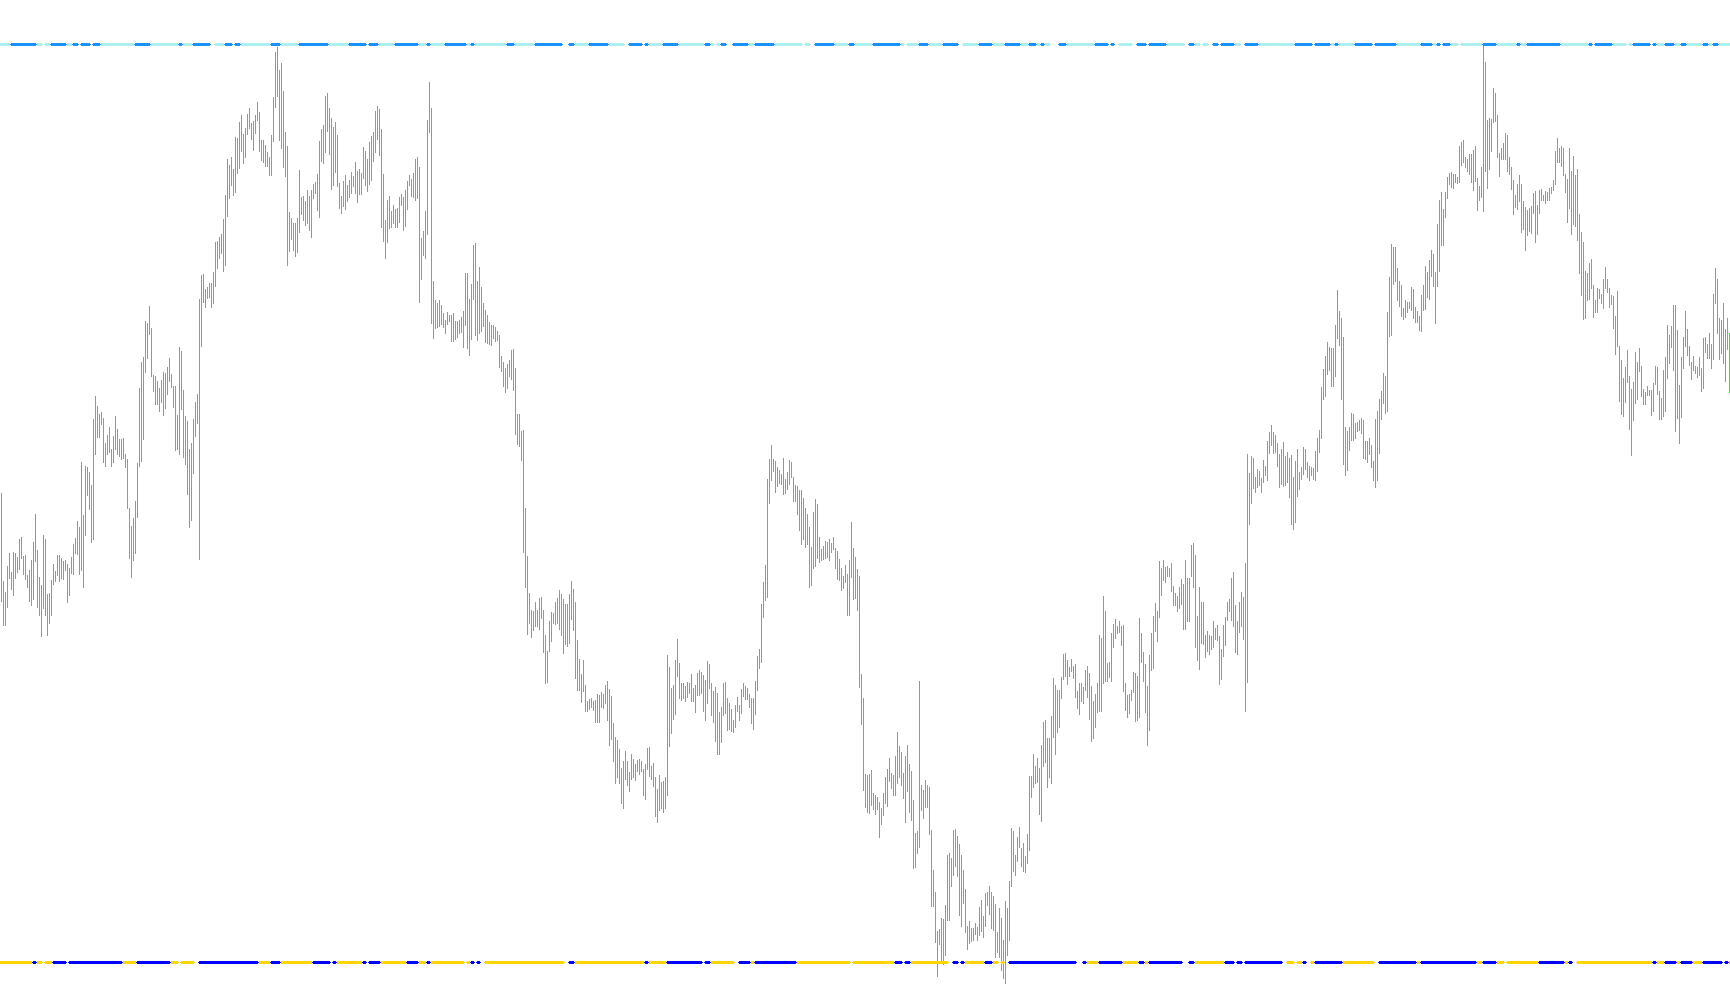
This technical tool, known as the Stealth BUYSELL indicator, is designed to provide traders with a visual roadmap of market momentum by identifying specific price interactions. Instead of cluttering your main chart, it operates in a separate window, creating a clear "signal zone" based on two primary moving average calculations.
Core Logic and Functionality
The indicator works by monitoring the relationship between current market prices and two distinct types of averages: a standard Simple Moving Average (SMA) and a more complex Linear Weighted Moving Average (LSMA).
1. The SMA Signal Zone
The script first calculates a standard average price over a user-defined period. It then evaluates where the current price sits in relation to this average:
- Upper Boundary: If the price is trading above the average, the tool identifies an upper threshold.
- Lower Boundary: If the price is trading below the average, it identifies a lower threshold.
- Visual Representation: These values are plotted as specific boundaries, effectively creating a "no-man's land" or a neutral zone between the high and low thresholds of the current trend.
2. The LSMA Momentum Filter
To add a layer of precision, the script incorporates a Linear Weighted Moving Average (LSMA). Unlike a standard average which treats all time periods equally, this calculation gives more importance to recent price action. This makes the indicator more sensitive to sudden shifts in market velocity.
The logic compares the current price against this weighted average:
- Buy/Sell Thresholds: The script identifies specific "trigger points" based on whether the price is currently pushing above or below this weighted line.
- Dynamic Boundaries: By setting these values at a specific distance from zero (customizable by the user), the tool creates clear, visual boundaries that highlight where the market might be reaching an exhaustion point or entering a new trend phase.
Summary for the Trader
In practical terms, the Stealth BUYSELL doesn't just tell you which way the price is moving; it defines the "territory" of the current move. By plotting these high and low boundaries based on both standard and weighted averages, it helps you visualize:
- The current strength of the trend.
- The "buffer zone" where the market is currently oscillating.
- Key levels where price action might be interacting with historical momentum, helping you stay ahead of the curve without being overwhelmed by raw data.
//+------------------------------------------------------------------+
//|                                              Stealth BUYSELL.mq4 |
//|                                                         Virginia |
//|                                      http://www.stealthforex.com |
//+------------------------------------------------------------------+
#property copyright "Virginia"
#property link      "http://www.stealthforex.com"

#property indicator_separate_window
#property indicator_buffers 4

#property indicator_color1 Red
#property indicator_color2 Lime
#property indicator_color3 Black
#property indicator_color4 Black

//------- Âíåøíèå ïàðàìåòðû ------------------------------------------
extern int SMAPeriod = 18; // Ïåðèîä ÅÌÀ
extern int LSMAPeriod = 18; // Ïåðèîä LSMA
extern int FromZero = 3; // Ðàññòîÿíèå îò íóëåâîãî óðîâíÿ

//------- Áóôåðû èíäèêàòîðà ------------------------------------------
double LineHighSMA[];
double LineLowSMA[];
double LSMABuffer1[];
double LSMABuffer2[];

//+------------------------------------------------------------------+
//| Custom indicator initialization function |
//+------------------------------------------------------------------+
void init() {
IndicatorDigits(2);

SetIndexBuffer(0, LineHighSMA);
SetIndexLabel (0, "SMA âûøå öåíû");
SetIndexStyle (0, DRAW_LINE, STYLE_SOLID, 3);
SetIndexBuffer(1, LineLowSMA);
SetIndexLabel (1, "SMA íèæå öåíû");
SetIndexStyle (1, DRAW_LINE, STYLE_SOLID, 3);
SetIndexBuffer(2, LSMABuffer1);
SetIndexLabel (2, "LSMA âûøå öåíû");
SetIndexStyle (2, DRAW_LINE, STYLE_SOLID, 3);
SetIndexBuffer(3, LSMABuffer2);
SetIndexLabel (3, "LSMA íèæå öåíû");
SetIndexStyle (3, DRAW_LINE, STYLE_SOLID, 3);
Comment("");
}

//+------------------------------------------------------------------+
//| Custom indicator iteration function |
//+------------------------------------------------------------------+
int start() {
double sum, lengthvar, tmp, wt;
int i, shift, counted_bars = IndicatorCounted();
int Draw4HowLong, loopbegin;

if (counted_bars<0) return;
if (counted_bars>0) counted_bars--;
counted_bars = Bars - counted_bars;
for (shift=0; shift<counted_bars; shift++) {
LineLowSMA[shift] = -FromZero;
LineHighSMA[shift] = -FromZero;

double SmaValue = iMA(NULL, 0, SMAPeriod, 0, MODE_SMA, PRICE_TYPICAL,
shift);
if (Close[shift]>SmaValue) LineHighSMA[shift] = EMPTY_VALUE;
if (Close[shift]<SmaValue) LineLowSMA[shift] = EMPTY_VALUE;
}

Draw4HowLong = Bars-LSMAPeriod - 5;
loopbegin = Draw4HowLong - LSMAPeriod - 1;

for(shift=loopbegin; shift>=0; shift--) {
sum = 0;
for (i=LSMAPeriod; i>=1; i--) {
lengthvar = LSMAPeriod + 1;
lengthvar /= 3;
tmp = 0;
tmp = (i - lengthvar) * Close[LSMAPeriod-i+shift];
sum+=tmp;
}
wt = sum * 6 / (LSMAPeriod * (LSMAPeriod + 1));

LSMABuffer1[shift] = FromZero;
LSMABuffer2[shift] = FromZero;

if (wt>Close[shift]) LSMABuffer2[shift] = EMPTY_VALUE;
if (wt<Close[shift]) LSMABuffer1[shift] = EMPTY_VALUE;
}
}
//+------------------------------------------------------------------+
Comments