StochCross_CCI
Download script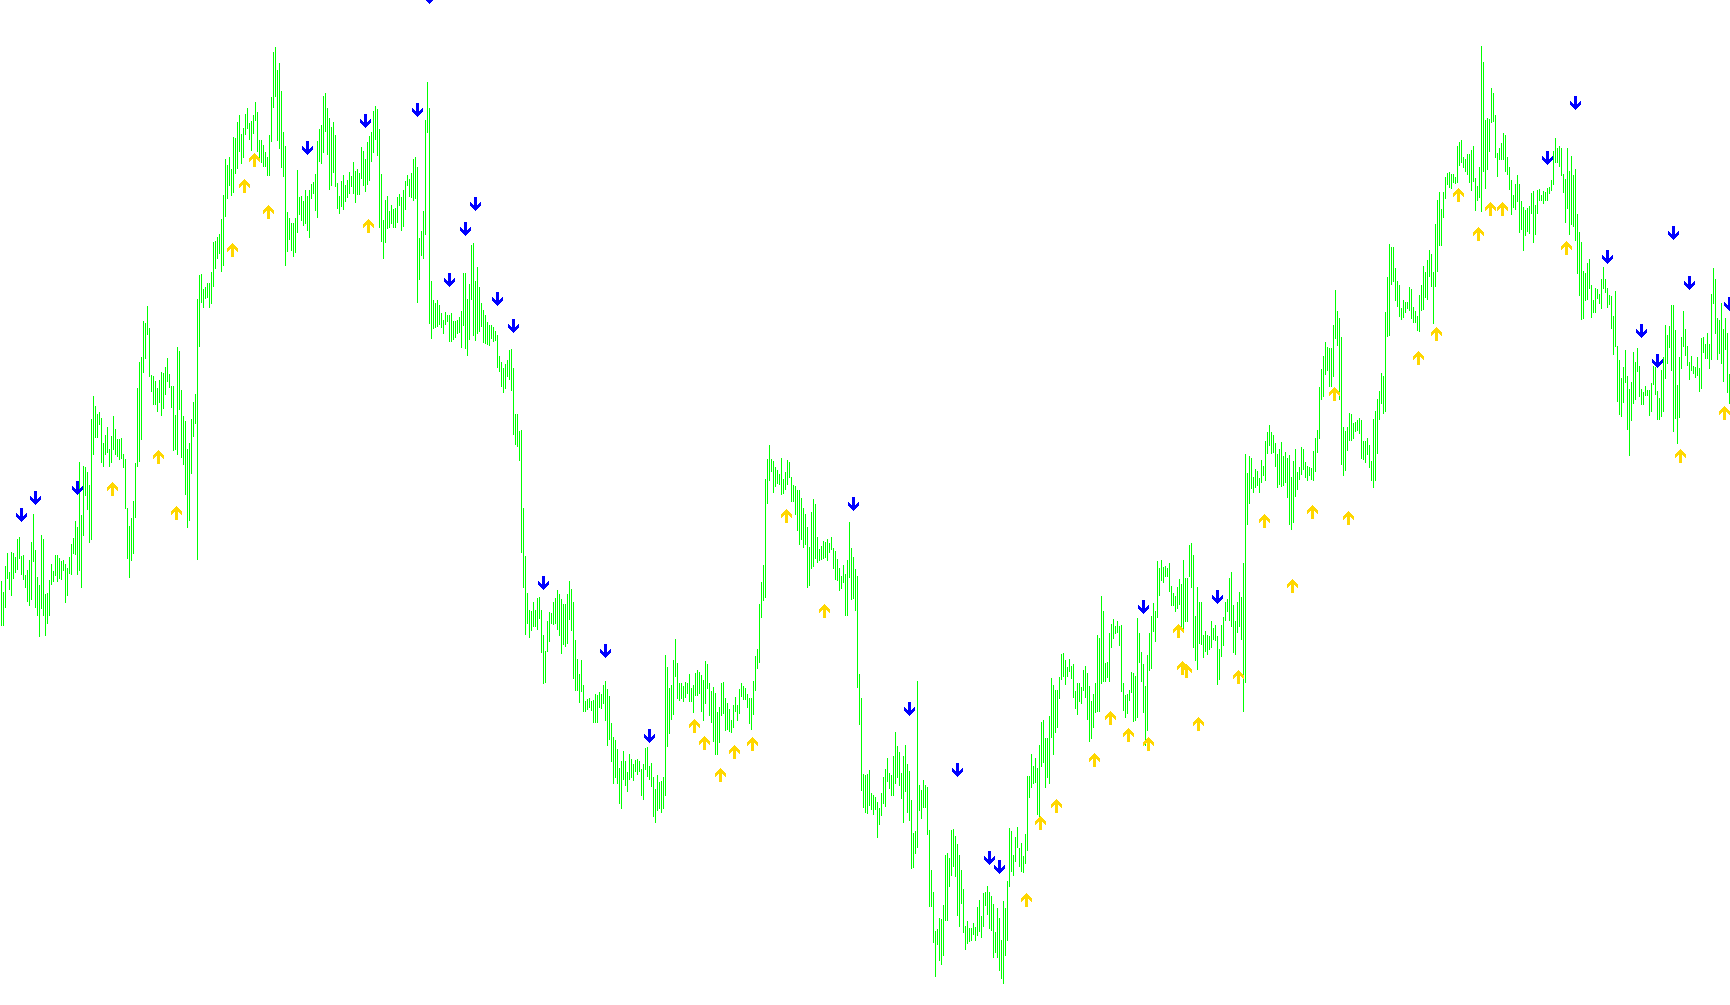
This tool is a technical analysis indicator designed to identify potential buying and selling opportunities by combining three different mathematical perspectives on market momentum. Rather than relying on a single signal, it acts as a "triple-filter" system, ensuring that a trade signal is only generated when multiple conditions align simultaneously.
Core Logic Components
The script analyzes the market using three distinct types of data:
1. The Stochastic Oscillator (The Momentum Cross) The primary trigger is based on the Stochastic Oscillator, which measures where the current price sits relative to its recent range. The indicator looks for a "crossover" between two specific lines:
- The Fast Line (%K): Represents immediate momentum.
- The Slow Line (%D): Represents a moving average of that momentum. A signal is triggered when the Fast Line crosses over the Slow Line, indicating a shift in the immediate direction of price movement.
2. The Trend CCI (The Market Environment) To ensure the tool doesn't provide signals during "choppy" or sideways markets, it uses a Commodity Channel Index (CCI) with a long-term period. This acts as a background filter:
- It checks if the overall market trend is positive (above zero) before suggesting a buy.
- It checks if the overall market trend is negative (below zero) before suggesting a sell.
3. The Entry CCI (The Precision Filter) A second, shorter-term CCI is used to refine the entry point. This layer provides an extra boundary of safety by ensuring the price isn't in an extreme "overbought" or "oversold" zone that could lead to a false signal. It validates that the momentum is moving in the correct direction relative to recent history.
How Signals Are Generated
The indicator only places a visual marker on your chart when all of the following conditions are met at once:
-
For a BUY Signal:
- The Fast Stochastic line must cross above the Slow Stochastic line.
- The long-term Trend CCI must be positive.
- The short-term Entry CCI must be rising and stay within a specific healthy range (not too high, not too low).
- Visual Result: A blue arrow appears below the price candle.
-
For a SELL Signal:
- The Fast Stochastic line must cross below the Slow Stochastic line.
- The long-term Trend CCI must be negative.
- The short-term Entry CCI must be falling and stay within a specific healthy range.
- Visual Result: A red arrow appears above the price candle.
Key Features for the User
- Dynamic Positioning: The arrows are automatically placed at a distance from the candles based on the recent volatility (range) of the market, ensuring they don't overlap with the price bars.
- Alert System: The script includes a notification system that can send an audible alert to your platform the moment a valid crossover occurs, including the current price and time frame.
- Customizable Sensitivity: Users can adjust the periods for the Stochastic Oscillator and both CCI filters to make the tool more "aggressive" (faster signals) or "conservative" (slower, more reliable signals).
//+----------------------------------------------------------------------------------+
//|                                   Stochastic CCI filtered crossed over indicator |
//+----------------------------------------------------------------------------------+
//|                                         Stochastic CCI filtered crossed over.mq4 |
//|                                                     Copyright © 2008, Melvin Tan |
//|                                                                                  |
//+----------------------------------------------------------------------------------+

#property copyright "Melvin Tan"
#property link      "none at the moment"

#property indicator_chart_window
#property indicator_buffers 2
#property indicator_color1 Blue
#property indicator_color2 Red

extern string note1 = "Stochastic settings";
extern int    KPeriod1     =  5;
extern int    DPeriod1     =  3;
extern int    Slowing1     =  3;
extern string note2 = "0=sma, 1=ema, 2=smma, 3=lwma";
extern int    MAMethod1    =   1;
extern string note3 = "0=high/low, 1=close/close";
extern int    PriceField1  =   0;
extern int    TrendCCI_Period = 50;
extern int    EntryCCI_Period = 14;
extern bool   AlertOn = false;

double CrossUp[];
double CrossDown[];

string AlertPrefix;
string GetTimeFrameStr() {
   switch(Period())
   {
      case 1 : string TimeFrameStr="M1"; break;
      case 5 : TimeFrameStr="M5"; break;
      case 15 : TimeFrameStr="M15"; break;
      case 30 : TimeFrameStr="M30"; break;
      case 60 : TimeFrameStr="H1"; break;
      case 240 : TimeFrameStr="H4"; break;
      case 1440 : TimeFrameStr="D1"; break;
      case 10080 : TimeFrameStr="W1"; break;
      case 43200 : TimeFrameStr="MN1"; break;
      default : TimeFrameStr=Period();
   }
   return (TimeFrameStr);
   }

//+------------------------------------------------------------------+
//| Custom indicator initialization function                         |
//+------------------------------------------------------------------+
int init()
  {
//---- indicators
      SetIndexStyle(0,DRAW_ARROW);
      SetIndexArrow(0, 233);
      SetIndexStyle(1,DRAW_ARROW);
      SetIndexArrow(1, 234);
      SetIndexBuffer(0, CrossUp);
      SetIndexBuffer(1, CrossDown);

      SetIndexEmptyValue(0,EMPTY_VALUE);
      SetIndexEmptyValue(1,EMPTY_VALUE);


   AlertPrefix=Symbol()+" ("+GetTimeFrameStr()+"):  ";
//----
   return(0);
  }
//+------------------------------------------------------------------+
//| Custom indicator deinitialization function                       |
//+------------------------------------------------------------------+
int deinit()
  {
//----

//----
   return(0);
  }
//+------------------------------------------------------------------+
bool NewBar()
{
   static datetime lastbar;
   datetime curbar = Time[0];
   if(lastbar!=curbar)
   {
      lastbar=curbar;
      return (true);
   }
   else
   {
      return(false);
   }
}
//+------------------------------------------------------------------+
//| Custom indicator iteration function                              |
//+------------------------------------------------------------------+
int start() {
   int limit, i, counter;
   double stochastic1now, stochastic2now, stochastic1previous, stochastic2previous, stochastic1after, stochastic2after;
   double Range, AvgRange;
   double TrendCCI, EntryCCInow, EntryCCIprevious;
   bool isbuy, issell;
   int counted_bars=IndicatorCounted();
//---- check for possible errors
   if(counted_bars<0) return(-1);
//---- last counted bar will be recounted
   if(counted_bars>0) counted_bars--;

   limit=Bars-counted_bars;

   for(i = 0; i <= limit; i++) {

      counter=i;
      Range=0;
      AvgRange=0;
      for (counter=i ;counter<=i+9;counter++)
      {
         AvgRange=AvgRange+MathAbs(High[counter]-Low[counter]);
      }
      Range=AvgRange/10;

      stochastic1now = iStochastic(NULL,0,KPeriod1,DPeriod1,Slowing1,MAMethod1,PriceField1,0,i);
      stochastic1previous = iStochastic(NULL,0,KPeriod1,DPeriod1,Slowing1,MAMethod1,PriceField1,0,i+1);
      stochastic2now = iStochastic(NULL,0,KPeriod1,DPeriod1,Slowing1,MAMethod1,PriceField1,1,i);
      stochastic2previous = iStochastic(NULL,0,KPeriod1,DPeriod1,Slowing1,MAMethod1,PriceField1,1,i+1);
      TrendCCI = iCCI(NULL, 0, TrendCCI_Period, PRICE_TYPICAL, i);
      EntryCCInow = iCCI(NULL, 0, EntryCCI_Period, PRICE_TYPICAL, i);
      EntryCCIprevious = iCCI(NULL, 0, EntryCCI_Period, PRICE_TYPICAL, i+1);

      if ((stochastic1now > stochastic2now) && (stochastic1previous < stochastic2previous) && (TrendCCI > 0) && (EntryCCInow > EntryCCIprevious) && (EntryCCInow > -100) && (EntryCCInow < 200))
      {
                   CrossUp[i] = Low[i] - Range*1.5;
                   if (AlertOn && NewBar()) {
                      Alert(AlertPrefix+"Stoch ("+KPeriod1+","+DPeriod1+","+Slowing1+") %K crosses UP %D\nBUY signal @ Ask = ",Ask,"; Bid = ",Bid,"\nDate & Time = ",TimeToStr(CurTime(),TIME_DATE)," ",TimeHour(CurTime()),":",TimeMinute(CurTime()));
                   }
      }
      else if ((stochastic1now < stochastic2now) && (stochastic1previous > stochastic2previous) && (TrendCCI < 0) && (EntryCCInow < EntryCCIprevious) && (EntryCCInow < 100) && (EntryCCInow > -200))
      {
                 CrossDown[i] = High[i] + Range*1.5;
                   if (AlertOn && NewBar()){
                      Alert(AlertPrefix+"Stoch ("+KPeriod1+","+DPeriod1+","+Slowing1+") %K crosses DOWN %D\nSELL signal @ Ask = ",Ask,"; Bid = ",Bid,"\nDate & Time = ",TimeToStr(CurTime(),TIME_DATE)," ",TimeHour(CurTime()),":",TimeMinute(CurTime()));
                   }
      }
      else
      {
      CrossUp[i] = EMPTY_VALUE;
      CrossDown[i] = EMPTY_VALUE;
      }

   }
   return(0);
}
Comments