Stop reversal_v1
Download script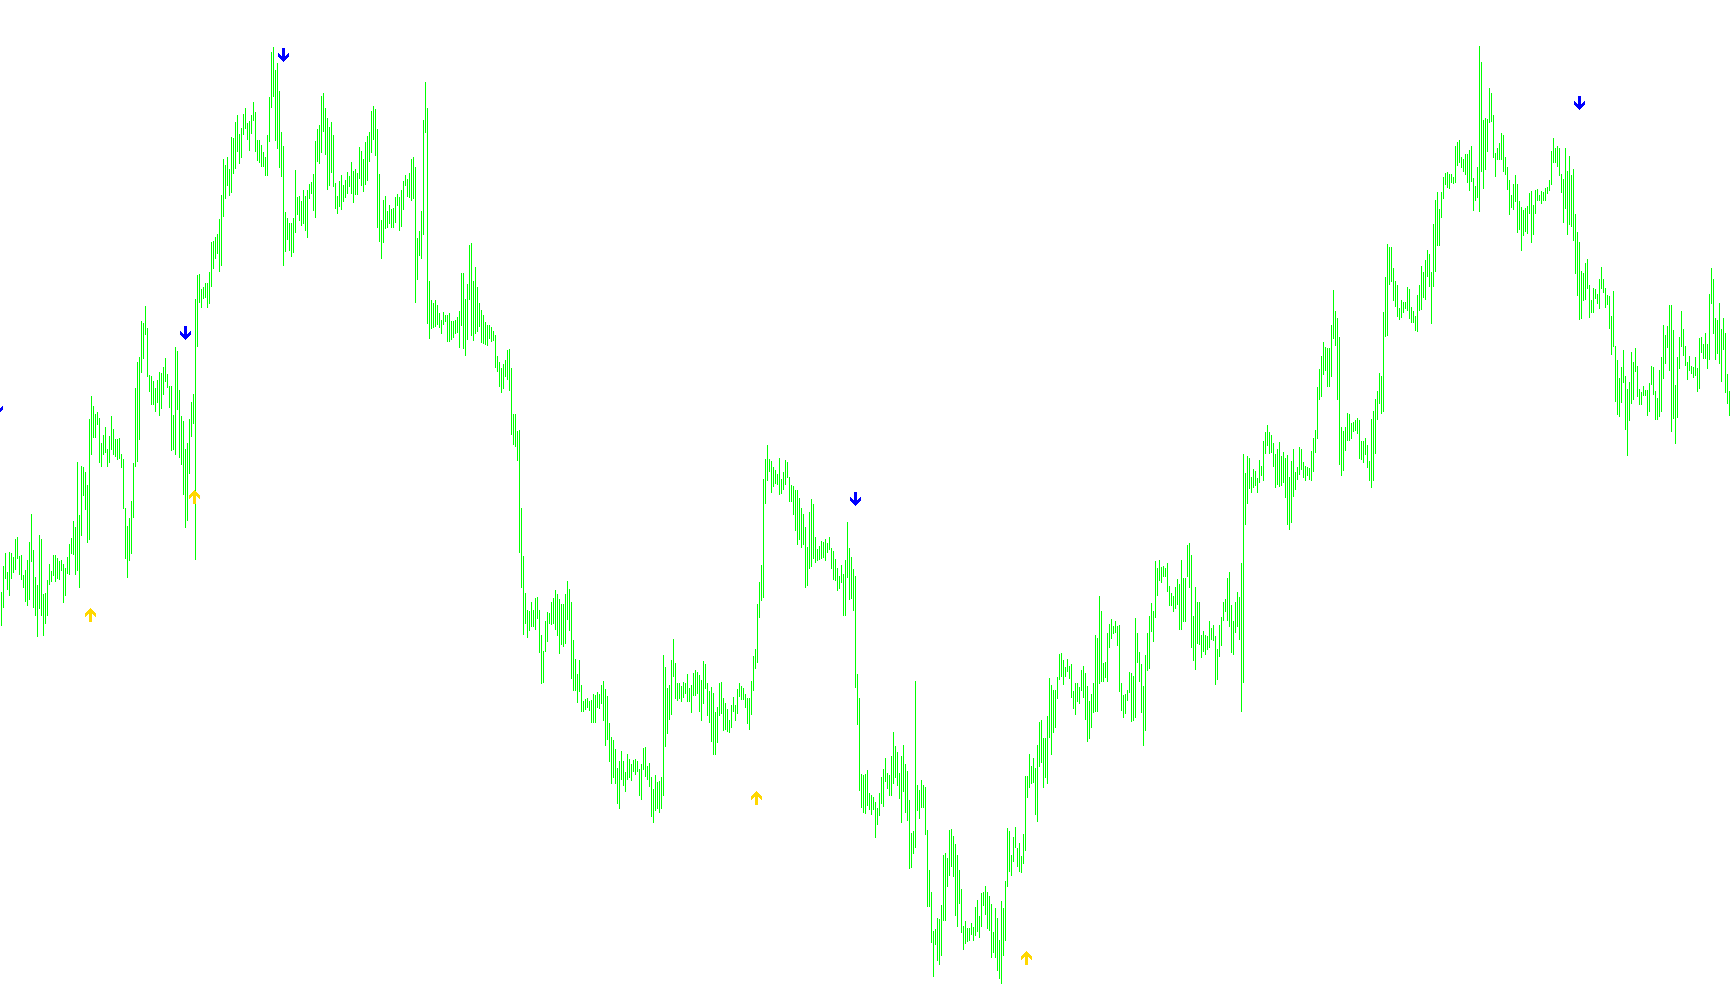
This script is designed to function as a visual indicator for MetaTrader 4, specifically aimed at identifying potential "reversal" points in price action. Rather than relying on standard momentum indicators, it focuses on tracking the behavior of historical closing prices to determine where a trend might be shifting from bullish to bearish (or vice versa).
Core Logic Overview
The logic operates by constantly monitoring the relationship between the current market price and a dynamically updated "Stop Level." It essentially tracks the movement of the market to see if it is consistently breaking in one direction or if it is beginning to "pull back" significantly enough to suggest a change in sentiment.
How the Mechanism Works
To achieve this, the script follows a specific sequence of logic:
- Price Tracking: The script remembers the previous "Stop Level" and compares it against the most recent closing prices.
- Trend Identification:
- If the market is moving consistently in one direction (e.g., prices are steadily climbing), the script adjusts the Stop Level to follow that movement, incorporating a small buffer (defined by the
nPipsvariable). This ensures that minor fluctuations don't trigger a false signal. - If the price moves in the opposite direction of the established trend, the script recalculates where the "breaking point" is.
- If the market is moving consistently in one direction (e.g., prices are steadily climbing), the script adjusts the Stop Level to follow that movement, incorporating a small buffer (defined by the
- Reversal Signaling: The actual visual signals on your chart are triggered when the market price crosses this calculated Stop Level after coming from the opposite direction.
- Buy Signals: These appear when the current price rises above the Stop Level, but only if the previous movement was downward.
- Sell Signals: These appear when the current price drops below the Stop Level, but only if the previous movement was upward.
Visual Representation
Once these conditions are met, the script places specific visual markers on your chart:
- Lime Markers: Represent potential areas for long (buy) positions where a downward move has been interrupted by an upward break.
- Red Markers: Represent potential areas for short (sell) positions where an upward move has been interrupted by a downward break.
Key Summary for the User
In plain terms, this tool looks for "exhaustion" in price movement. It identifies when a trend is losing its strength and creates a dynamic boundary. When the price breaches that boundary from the opposite side of the previous trend, the script highlights it on your screen as a potential reversal point.
/*-----------------------------+
|			       |
| Shared by www.Aptrafx.com    |
|			       |
+------------------------------*/

//+------------------------------------------------------------------

//|                                            Stopreversal Mt4.mq4
//|
//|

//|                                 Conversion only Dr. Gaines

//|                                 dr_richard_gaines@yahoo.com

//|

//+------------------------------------------------------------------


#property copyright " Dominic."
#property link      " http://www.metaquotes.net/"

#property indicator_chart_window
#include <stdlib.mqh>
#property indicator_buffers 2
#property indicator_color1 Lime
#property indicator_width1 2
#property indicator_color2 Red
#property indicator_width2 2


//+------------------------------------------------------------------

//| Common External variables

//+------------------------------------------------------------------


//+------------------------------------------------------------------

//| External variables

//+------------------------------------------------------------------

extern double nPips = 0.004;

//+------------------------------------------------------------------

//| Special Convertion Functions

//+------------------------------------------------------------------


int LastTradeTime;
double ExtHistoBuffer[];
double ExtHistoBuffer2[];

void SetLoopCount(int loops)
{
}

void SetIndexValue(int shift, double value)
{
  ExtHistoBuffer[shift] = value;
}

void SetIndexValue2(int shift, double value)
{
  ExtHistoBuffer2[shift] = value;
}

//+------------------------------------------------------------------

//| End

//+------------------------------------------------------------------


//+------------------------------------------------------------------

//| Initialization

//+------------------------------------------------------------------


int init()
{
   SetIndexStyle(0, DRAW_ARROW, STYLE_SOLID);
   SetIndexArrow(0, 233);
   SetIndexBuffer(0, ExtHistoBuffer);
   SetIndexStyle(1, DRAW_ARROW, STYLE_SOLID);
   SetIndexArrow(1, 234);
   SetIndexBuffer(0, ExtHistoBuffer);
   SetIndexBuffer(1, ExtHistoBuffer2);
   return(0);
}
int start()
{
//+------------------------------------------------------------------

//| Local variables

//+------------------------------------------------------------------

int shift = 0;
double cnt = 0;
double TrStopLevel = 0;
double PREV = 0;
double pass = 0;

SetLoopCount(0);
// loop from first bar to current bar (with shift=0)
for(shift=Bars-2;shift>=0 ;shift--){


if( (Close[shift] == PREV) )
{
TrStopLevel=PREV;

}
else
{
if( (Close[shift+1])<PREV && (Close[shift]<PREV)  )
{
TrStopLevel=MathMin(PREV,Close[shift]*(1+nPips));
}

      else
      {
            if( ((Close[shift+1])>PREV) && (Close[shift]>PREV) )
            {
            TrStopLevel=MathMax(PREV,Close[shift]*(1-nPips));
            }


            else
                  {
                  if( (Close[shift]>PREV) )
                  {
                  TrStopLevel=Close[shift]*(1-nPips);
                  }

                        else TrStopLevel=Close[shift]*
(1+nPips);
                  }
      }
}


if( Close[shift] > TrStopLevel &&  Close[shift+1]<PREV && PREV !=
0 )
{
//SetOrder(OP_BUY,1,ask,2,0,ask+TakeProfit*Point,blue);
//Alert("buy");
SetIndexValue(shift, TrStopLevel);
}


if( Close[shift] < TrStopLevel &&  Close[shift+1]>PREV  && PREV !=
0  )
{
//SetOrder(OP_SELL,1,bid,2,0,bid-TakeProfit*Point,Red);
SetIndexValue2(shift, TrStopLevel);
//Alert("Sell");
}


PREV=TrStopLevel;
//Alert(TrStopLevel);
}

  return(0);
}
Comments