super signals v2
Download script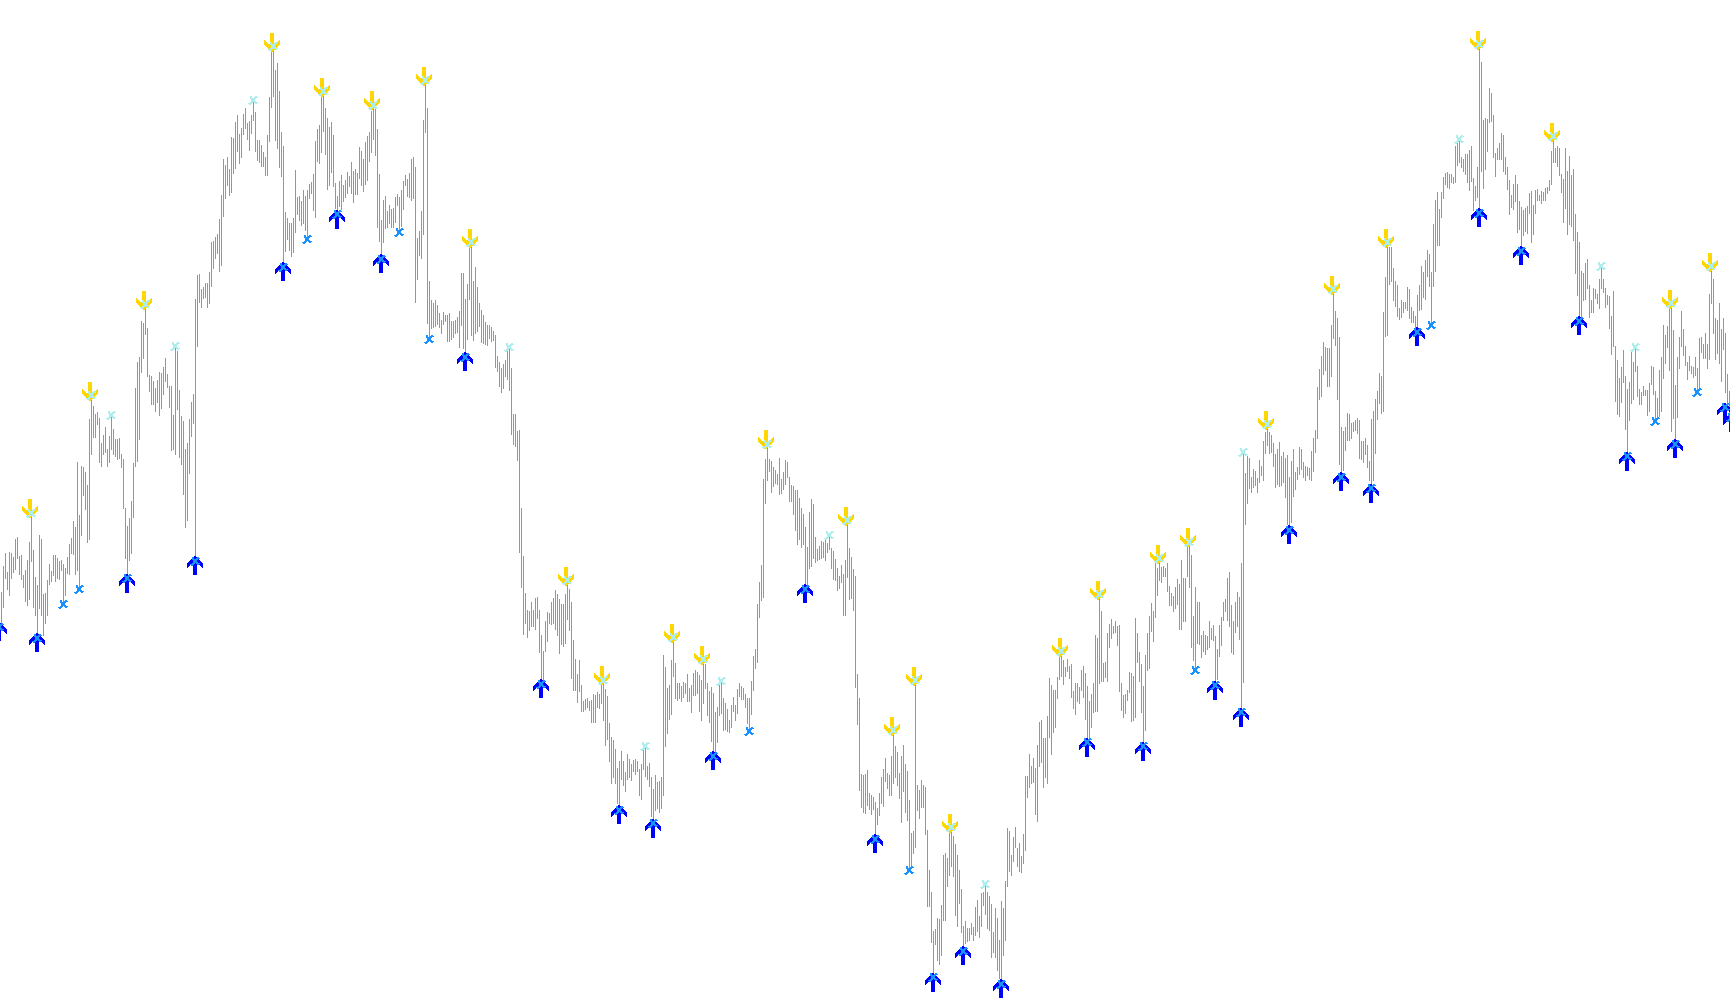
The Super-Signals v2 indicator is designed to provide visual cues on your trading charts by identifying significant price extremes within specific timeframes. Instead of relying on lagging averages, this tool scans the market history to pinpoint "peaks" and "valleys," helping traders see where price momentum has reached its limits.
How the Logic Works
The script operates by analyzing two different layers of price movements simultaneously. It looks back at a set number of candles (price bars) to determine the highest highs and lowest lows:
- Short-Term Analysis: The tool identifies price extremes over a shorter window (set at 14 periods). This helps highlight more immediate fluctuations in the market.
- Long-Term Analysis: The tool simultaneously identifies extremes over a broader window (set at 21 periods). This captures larger, more significant trend movements.
Visual Signals on Your Chart
When the script detects that a specific candle is the highest or lowest point within these defined windows, it places an arrow directly on your chart to alert you:
- High Point Alerts: When the price reaches a new peak in either the short-term or long-term calculation, the script marks these areas. These signals often represent points where buying pressure may be exhausted.
- Low Point Alerts: Conversely, when the price hits a new bottom within the analyzed windows, the script marks these spots. These signals can indicate areas where selling pressure might be weakening.
Summary for Traders
By combining both short and long-term perspectives into one visual display, this indicator allows you to see "structural" turning points in the market. It provides a clear map of where the price has historically reached its limits, helping you identify potential reversal zones or areas of significant interest where price action is reacting strongly.
//+------------------------------------------------------------------+
//|                                             super-signals_v2.mq4 |
//|                Copyright © 2006, Nick Bilak, beluck[AT]gmail.com |
//+------------------------------------------------------------------+
#property copyright "Copyright © 2006, Nick Bilak"
#property copyright "alterations by Mark Tomlinson"
#property link      "http://www.forex-tsd.com/"

#property indicator_chart_window
#property indicator_buffers 4
#property indicator_color1 Yellow
#property indicator_color2 Lime
#property indicator_color3 Red
#property indicator_color4 Aqua
//input properties

extern int dist2=21;
extern int dist1=14;
double b1[];
double b2[];
double b3[];
double b4[];


int init()  {
   SetIndexStyle(0,DRAW_ARROW,STYLE_SOLID,2);
   SetIndexStyle(1,DRAW_ARROW,STYLE_SOLID,2);
   SetIndexStyle(2,DRAW_ARROW,STYLE_SOLID,2);
   SetIndexStyle(3,DRAW_ARROW,STYLE_SOLID,2);
   SetIndexArrow(1,333);
   SetIndexArrow(0,334);
   SetIndexArrow(1,233);
   SetIndexArrow(0,234);
   SetIndexBuffer(0,b1);
   SetIndexBuffer(1,b2);
   SetIndexBuffer(2,b3);
   SetIndexBuffer(3,b4);
   return(0);
}
int start() {
   int counted_bars=IndicatorCounted();
   int k,i,j,limit,hhb,llb,hhb1,llb1;

   if (counted_bars<0) return(-1);
   if (counted_bars>0) counted_bars--;
   limit=Bars-1;
   if(counted_bars>=1) limit=Bars-counted_bars-1;
   if (limit<0) limit=0;

   for (i=limit;i>=0;i--)   {
      hhb1 = Highest(NULL,0,MODE_HIGH,dist1,i-dist1/2);
      llb1 = Lowest(NULL,0,MODE_LOW,dist1,i-dist1/2);
      hhb= Highest(NULL,0,MODE_HIGH,dist2,i-dist2/2);
      llb= Lowest(NULL,0,MODE_LOW,dist2,i-dist2/2);

      if (i==hhb)
         b1[i]=High[hhb]+10*Point;
      if (i==llb)
         b2[i]=Low[llb]-10*Point;
      if (i==hhb1)
         b3[i]=High[hhb1]+4*Point;
      if (i==llb1)
         b4[i]=Low[llb1]-4*Point;
      }
  return(0);
}
Comments