super-signals_v2
Download script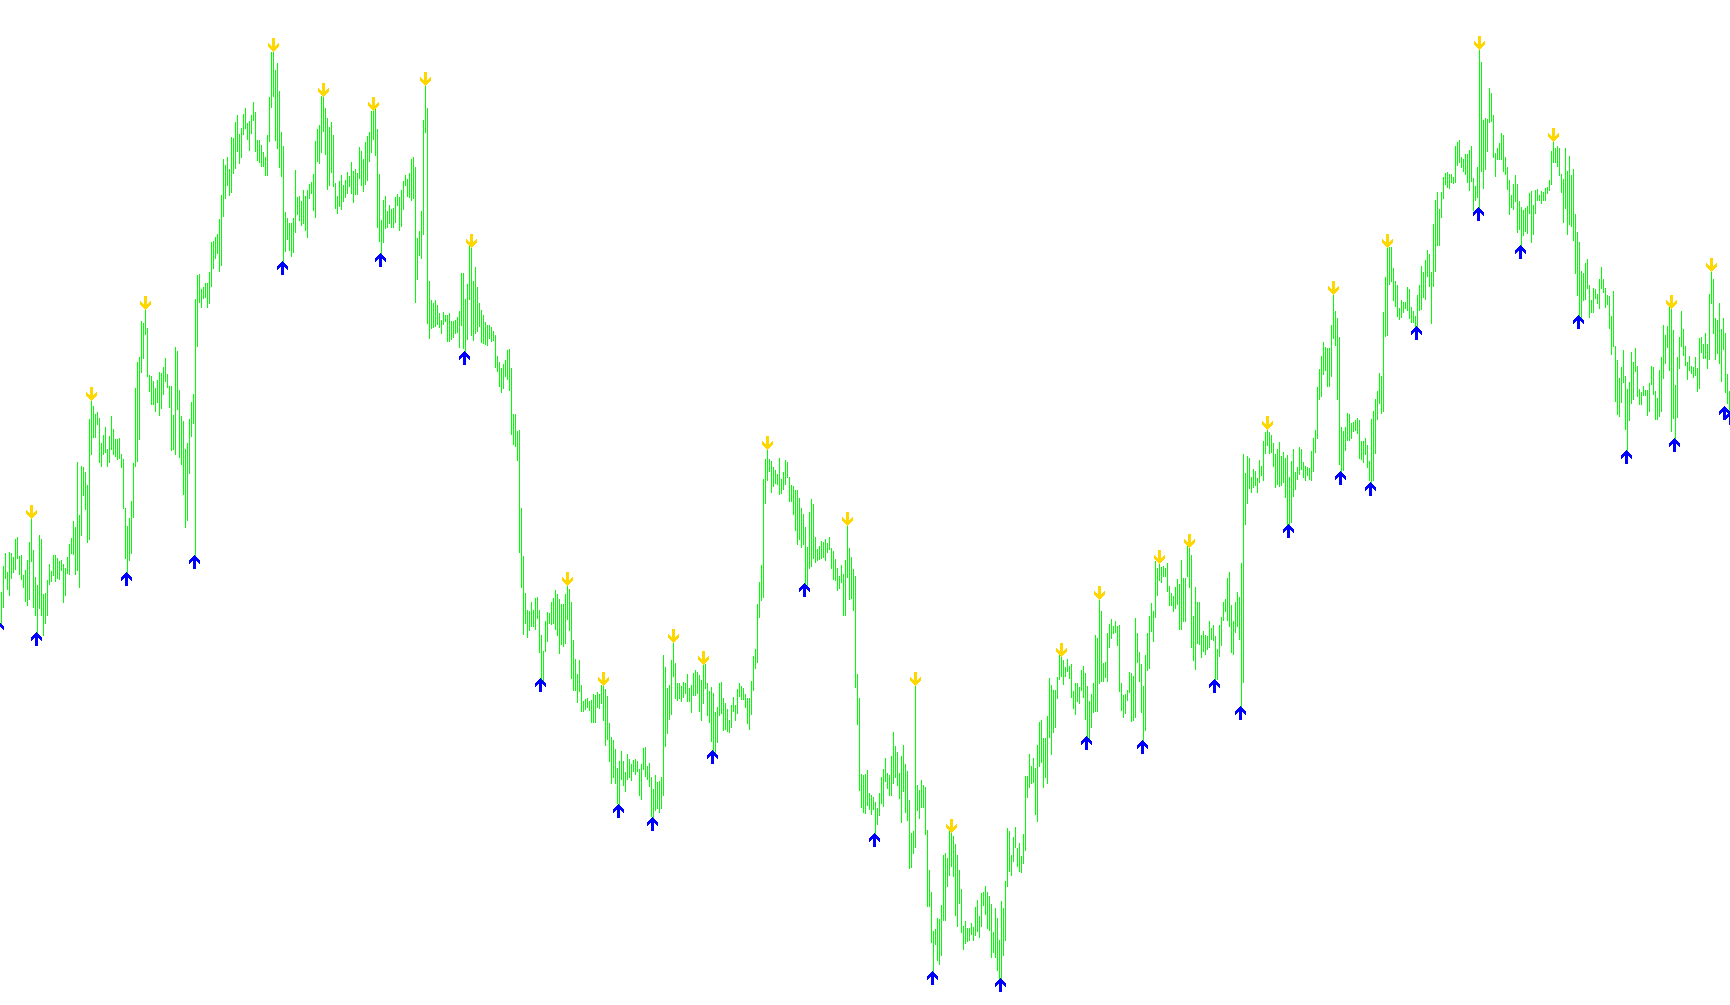
This indicator is designed to provide visual cues on a trading chart by identifying significant price peaks and valleys. Its primary purpose is to highlight "turning points" in the market, making it easier for traders to spot where the price has reached a temporary high or low within a specific timeframe.
How the Logic Works
The tool functions by constantly scanning the historical price data of the currency pair or asset you are viewing. Instead of looking at just one candle at a time, it analyzes a small "neighborhood" of price action—specifically looking back across a set number of bars to determine context.
Identifying High Points (Sell Signals) The script looks for the highest price reached within its defined window. If the current candle is identified as the absolute peak of that period, the indicator places a visual marker (a red arrow) above that specific candle. This suggests that the price has hit a local ceiling.
Identifying Low Points (Buy Signals) Similarly, the script searches for the lowest price reached within its defined window. When it identifies a candle as the absolute bottom of that period, it places a visual marker (a lime green arrow) below that candle. This suggests that the price has hit a local floor.
Visual Presentation To ensure these signals are easy to see and do not overlap with the actual candles:
- The Red Arrows appear slightly above the high of the peak candle.
- The Lime Green Arrows appear slightly below the low of the valley candle.
- There is a built-in "gap" setting that ensures these markers sit at a consistent distance from the price action, keeping the chart clean and readable.
Summary for the Trader
In simple terms, this script acts as an automated "high-low" hunter. It filters out minor price fluctuations to pinpoint the most significant structural points in recent price movement. By highlighting these peaks and valleys, it helps you visualize the market's structure and potentially identify areas where the trend might be exhausting or reversing.
/*-----------------------------+
|			       |
| Shared by www.Aptrafx.com    |
|			       |
+------------------------------*/

//+------------------------------------------------------------------+
//|                                                super-signals.mq4 |
//|                Copyright © 2006, Nick Bilak, beluck[AT]gmail.com |
//+------------------------------------------------------------------+
#property copyright "Copyright © 2006, Nick Bilak"
#property link      "http://www.forex-tsd.com/"

#property indicator_chart_window
#property indicator_buffers 2
#property indicator_color1 Red
#property indicator_width1 2
#property indicator_color2 Lime
#property indicator_width2 2

extern int SignalGap = 4;

int dist=24;
double b1[];
double b2[];

int init()  {
   SetIndexStyle(0,DRAW_ARROW,STYLE_SOLID,1);
   SetIndexStyle(1,DRAW_ARROW,STYLE_SOLID,1);
   SetIndexArrow(1,233);
   SetIndexArrow(0,234);
   SetIndexBuffer(0,b1);
   SetIndexBuffer(1,b2);
   return(0);
}
int start() {
   int counted_bars=IndicatorCounted();
   int k,i,j,limit,hhb,llb;

   if (counted_bars<0) return(-1);
   if (counted_bars>0) counted_bars--;
   limit=Bars-1;
   if(counted_bars>=1) limit=Bars-counted_bars-1;
   if (limit<0) limit=0;

   for (i=limit;i>=0;i--)   {
      hhb = Highest(NULL,0,MODE_HIGH,dist,i-dist/2);
      llb = Lowest(NULL,0,MODE_LOW,dist,i-dist/2);

      if (i==hhb)
         b1[i]=High[hhb]+SignalGap*Point;
      if (i==llb)
         b2[i]=Low[llb]-SignalGap*Point;
   }
   return(0);
}
Comments