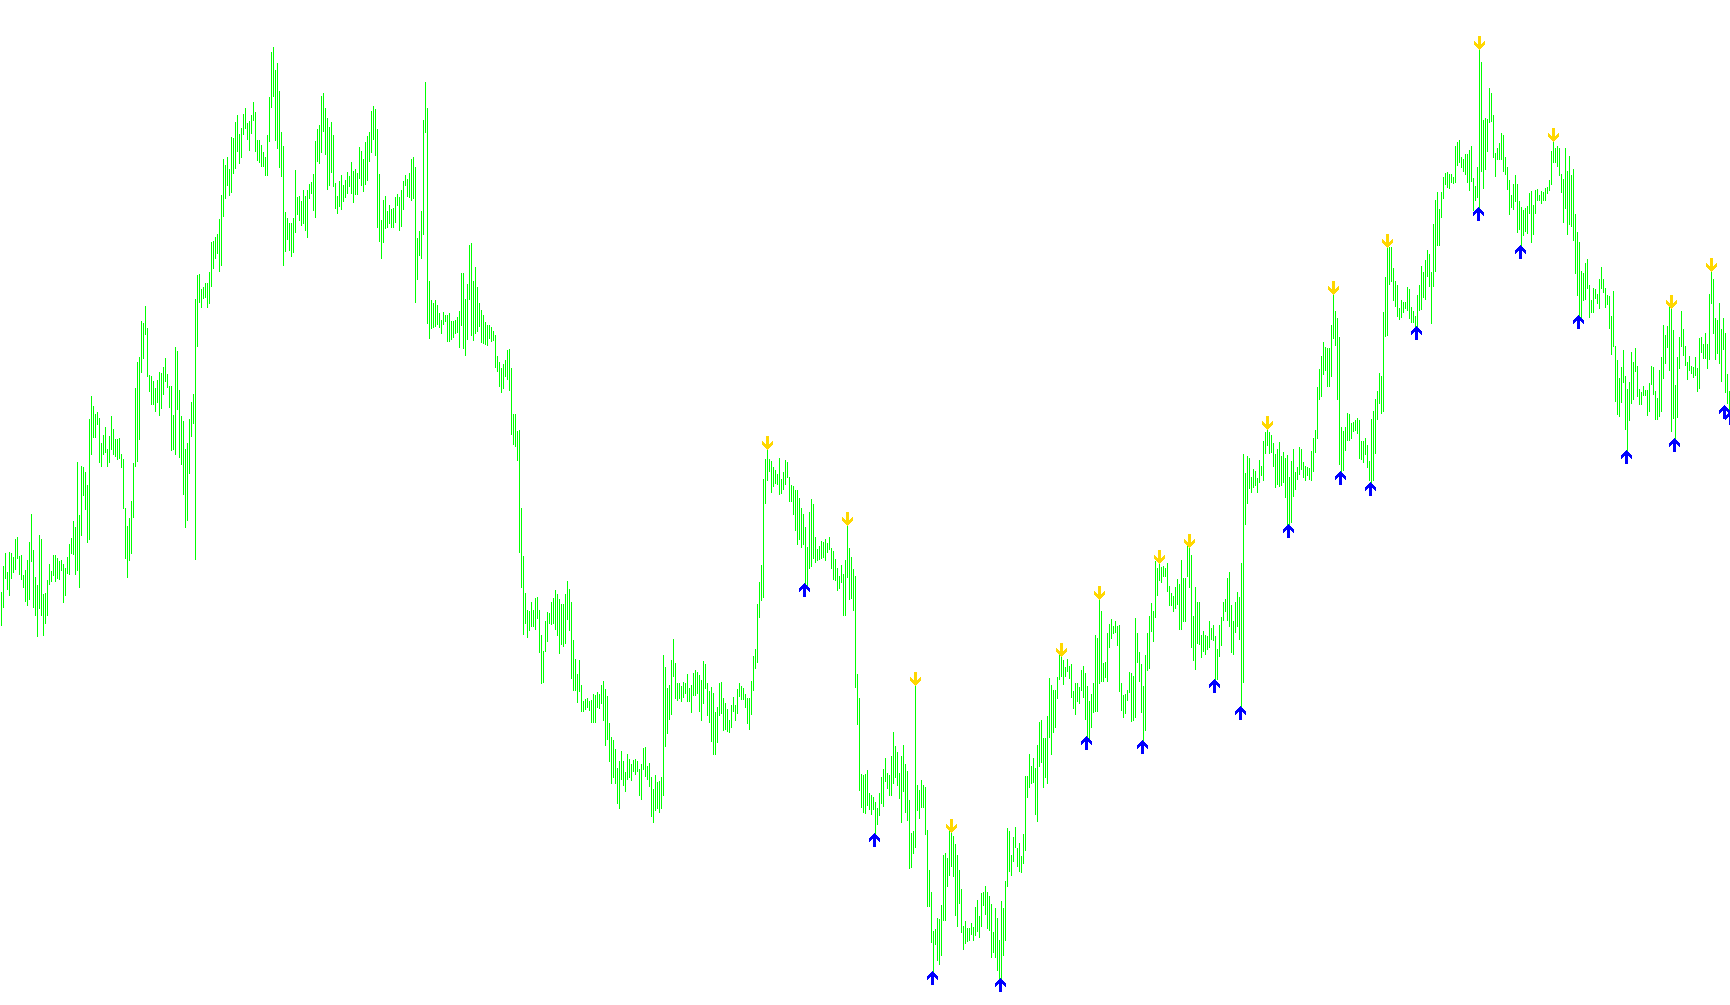
This tool is designed to visually identify significant price peaks and valleys on your trading chart, helping you spot potential turning points in the market trend. Rather than cluttering your screen with constant data, it acts as a highlighting system that marks "local" highs and lows based on a specific window of time.
How the Logic Works
The script scans the historical price action to find the highest and lowest points within a defined range. Here is a breakdown of how it processes that information:
- The Scanning Window: The tool looks at a set number of previous candles (defined by the "BarsTo Count" setting) to establish a context for what constitutes a "high" or a "low."
- Peak and Valley Detection: For every candle in that range, the script compares its price against its neighbors. If a specific candle reaches a higher point than all others within its immediate vicinity (determined by the "dist" variable), it identifies this as a peak. Conversely, if a candle reaches a lower point than its neighbors, it is identified as a valley.
- Visual Signaling: Once these peaks and valleys are confirmed, the script places two distinct visual markers on your chart:
- Red Arrows: These appear above the highest points (peaks) to alert you to areas where the price has pushed upward significantly before retreating.
- Lime Arrows: These appear below the lowest points (valleys) to highlight areas where the price has dropped significantly before potentially bouncing back.
- Spacing and Clarity: To ensure the markers do not overlap directly with the price candles, the script includes a "Signal Gap." This creates a small amount of breathing room between the tip of the arrow and the actual price candle, making the signals much easier to read at a glance.
Summary for Traders
Essentially, this script automates the process of identifying "swing highs" and "swing lows." By doing this automatically, it allows you to see the structural backbone of the market trend more clearly, highlighting the extremes where the price has shown significant strength or weakness over a specific period.
//+------------------------------------------------------------------+
//|                                                super-signals.mq4 |
//|                Copyright © 2006, Nick Bilak, beluck[AT]gmail.com |
//+------------------------------------------------------------------+
#property copyright "Copyright © 2006, Nick Bilak"
#property link      "http://www.forex-tsd.com/"

#property indicator_chart_window
#property indicator_buffers 2
#property indicator_color1 Red
#property indicator_width1 2
#property indicator_color2 Lime
#property indicator_width2 2

extern int SignalGap = 4;
extern int BarsToCount = 500;

int OneInitOnly=true;

int dist=24;
double b1[];
double b2[];

int init()
  {
   SetIndexStyle(0,DRAW_ARROW,STYLE_SOLID,1);
   SetIndexArrow(0,234);
   SetIndexBuffer(0,b1);

   SetIndexStyle(1,DRAW_ARROW,STYLE_SOLID,1);
   SetIndexArrow(1,233);
   SetIndexBuffer(1,b2);

   if(OneInitOnly==true)
     {
      int i;
      OneInitOnly=false;
      for (i=BarsToCount;i>=0;i--)
        {
         b1[i]=EMPTY_VALUE;
         b2[i]=EMPTY_VALUE;
        }
     }
  }

int start() {
   int k,i,j,limit,hhb,llb;

   for (i=BarsToCount;i>=0;i--)
     {
      hhb = iHighest(Symbol(),0,MODE_HIGH,dist,i-dist/2);
      llb = iLowest(Symbol(),0,MODE_LOW,dist,i-dist/2);

      if (i==hhb) b1[i]=High[hhb]+SignalGap*Point;
      if (i==llb) b2[i]=Low[llb]-SignalGap*Point;
     }

}
Comments