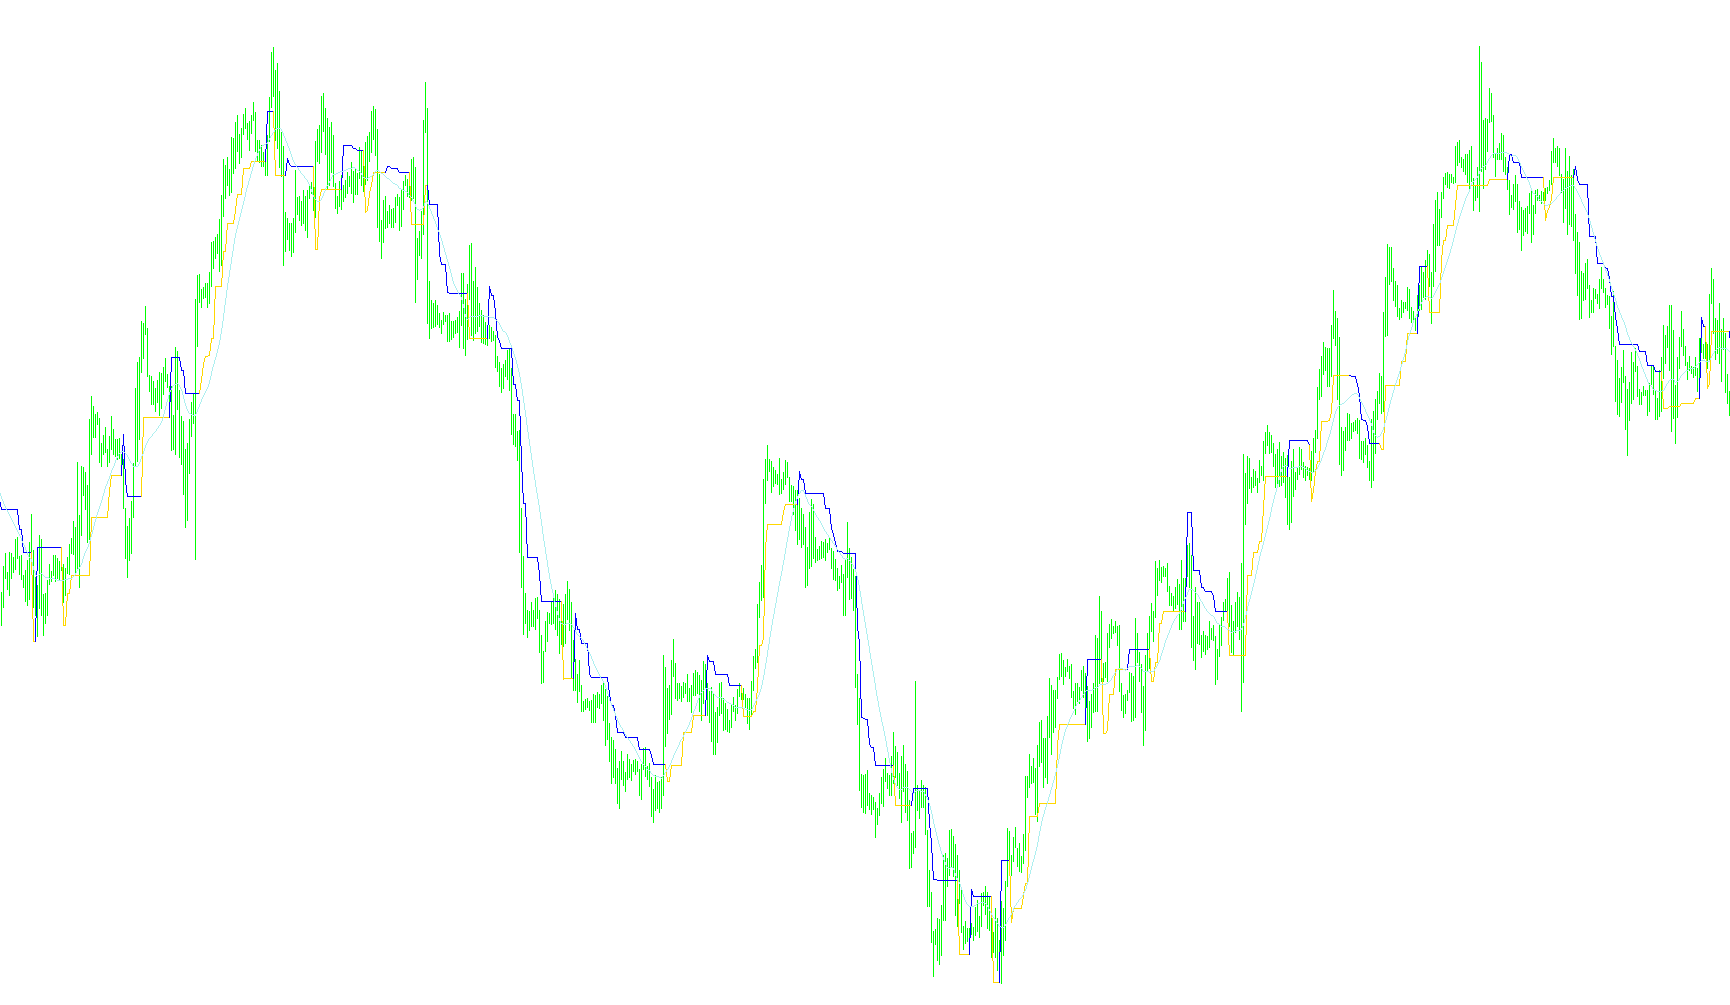
The Supertrend2 indicator is designed to provide a visual representation of market direction by identifying current trends and potential reversal points. It achieves this by comparing different layers of historical price data to determine whether the market is moving in an upward or downward trajectory.
Core Logic Overview
The script functions by analyzing three distinct components:
1. Price Averaging and Comparison The tool first calculates two separate averages based on a specific number of periods (the "NbPeriods").
- The first average focuses on the most recent price action.
- The second average looks at a slightly older set of historical data. By comparing these two averages, the script identifies the underlying momentum. If the recent average is higher than the older one, it signals upward pressure; if lower, it signals downward pressure.
2. Trend Identification Once the relationship between the two averages is established, the logic assigns a specific "Trend State." It uses a filtering mechanism to ensure the trend doesn't flip back and forth erratically during minor price fluctuations. This creates a smoother transition between "Up" and "Down" states, ensuring that the trend line remains stable unless a significant shift in price action occurs.
3. Dynamic Support and Resistance (The Supertrend Line) Based on the current trend state identified above, the script draws specific lines on your chart:
- In an Uptrend: The indicator calculates a support level. This is done by taking the current price and subtracting a volatility measurement (ATR). It then applies a "lock" logic: the line will only move upward or stay flat. If the price drops, the line stays put as a floor until the trend officially reverses.
- In a Downtrend: The indicator calculates a resistance level by adding the volatility measurement to the current price. Similarly, it employs a "lock" logic where the line will only move downward or stay flat, acting as a ceiling for the price.
Key Features
- Automatic Timeframe Scaling: If enabled, the indicator can automatically adjust its sensitivity based on the chart timeframe you are viewing (e.g., using different period settings for a 1-minute chart versus a Daily chart).
- Average Price Line: Users have the option to display an additional average price line to help visualize the median price between the two historical averages.
- Visual Signals: The script distinguishes between trends using different colors (typically Lime for upward and Red for downward), providing a clear, at-a-glance view of market sentiment.
Summary for Traders
Essentially, this script acts as a "smart" moving average that reacts to volatility. Instead of just following the price blindly, it calculates a dynamic floor or ceiling. When the price is above the line, the trend is considered bullish; when it breaks below, the logic flips to identify a bearish trend and establishes a new ceiling.
//+------------------------------------------------------------------+
//|                                                  Supertrend2.mq4 |
//|                   Copyright © 2005, Jason Robinson (jnrtrading). |
//|                                      http://www.jnrtrading.co.uk |
//+------------------------------------------------------------------+
#property copyright "Copyright © 2005, Jason Robinson (jnrtrading)."
#property link      "http://www.jnrtrading.co.uk"

#property indicator_chart_window
#property indicator_buffers 3
#property indicator_color1 Lime
#property indicator_color2 Red
#property indicator_color3 Orange
#property indicator_width1 2
#property indicator_width2 2
#property indicator_width3 2

double TrendUp[], TrendDown[], Price1[], Price2[], AvgPrice[], Trend[];
int UpDownShift;
double price1, price2;

extern int NbPeriods = 10;
extern bool Display_SuperTrend = true;
extern bool Display_Average_Price_Line = true;
extern bool Automatic_Timeframe_Settings = false;
extern int M1_NbPeriods = 10;
extern int M5_NbPeriods = 10;
extern int M15_NbPeriods = 10;
extern int M30_NbPeriods = 10;
extern int H1_NbPeriods = 10;
extern int H4_NbPeriods = 10;
extern int D1_NbPeriods = 10;
extern int W1_NbPeriods = 10;
extern int MN_NbPeriods = 10;
//+------------------------------------------------------------------+
//| Custom indicator initialization function                         |
//+------------------------------------------------------------------+
int init()
  {
//---- indicators

   IndicatorBuffers(6);
   SetIndexBuffer(0, TrendUp);
   SetIndexStyle(0, DRAW_LINE, STYLE_SOLID);
   SetIndexBuffer(1, TrendDown);
   SetIndexStyle(1, DRAW_LINE, STYLE_SOLID);
   SetIndexBuffer(2, AvgPrice);
   SetIndexStyle(2, DRAW_LINE, STYLE_SOLID);
   SetIndexBuffer(3, Price1);
   SetIndexBuffer(4, Price2);
   SetIndexBuffer(5, Trend);
     SetIndexLabel(0,"ST2("+NbPeriods+")TrendUp");
     SetIndexLabel(1,"ST2("+NbPeriods+")TrendDn");
     SetIndexLabel(2,"ST2("+NbPeriods+")AvgPrice");
    IndicatorShortName("Super_Trend2");

   /*switch(Period()) {
      case 1:     UpDownShift = 5;   break;
      case 5:     UpDownShift = 9;  break;
      case 15:    UpDownShift = 10;   break;
      case 30:    UpDownShift = 11;   break;
      case 60:    UpDownShift = 30;  break;
      case 240:   UpDownShift = 45;  break;
      case 1440:  UpDownShift = 55;  break;
      case 10080: UpDownShift = 150; break;
      case 43200: UpDownShift = 350; break;
   }*/
//----
   return(0);
  }
//+------------------------------------------------------------------+
//| Custor indicator deinitialization function                       |
//+------------------------------------------------------------------+
int deinit()
  {
//----

//----
   return(0);
  }
//+------------------------------------------------------------------+
//| Custom indicator iteration function                              |
//+------------------------------------------------------------------+
int start()
  {
   int limit, i, j, shift;
   double Price3;
   int counted_bars = IndicatorCounted();
//---- check for possible errors
   if(counted_bars < 0) return(-1);
//---- last counted bar will be recounted
   if(counted_bars > 0) counted_bars--;

   limit=Bars-counted_bars;

   if (Automatic_Timeframe_Settings == true) {
      switch(Period()) {
         case 1:     NbPeriods = M1_NbPeriods;   break;
         case 5:     NbPeriods = M5_NbPeriods;  break;
         case 15:    NbPeriods = M15_NbPeriods;   break;
         case 30:    NbPeriods = M30_NbPeriods;   break;
         case 60:    NbPeriods = H1_NbPeriods;  break;
         case 240:   NbPeriods = H4_NbPeriods;  break;
         case 1440:  NbPeriods = D1_NbPeriods;  break;
         case 10080: NbPeriods = W1_NbPeriods; break;
         case 43200: NbPeriods = MN_NbPeriods; break;
      }
   }

   for (i = limit; i >= 0; i--) {
      Price1[i] = 0;
      Price2[i] = 0;
      for(j = 0; j < NbPeriods; j++) {
         Price1[i] = Price1[i] + ((High[i+j] + Low[i+j] + Close[i+j])/3);
      }
      Price1[i] = Price1[i] / NbPeriods;
      for(j = NbPeriods; j < (NbPeriods*2); j++) {
         Price2[i] = Price2[i] + ((High[i+j] + Low[i+j] + Close[i+j])/3);
      }
      Price2[i] = Price2[i] / NbPeriods;
   }
   for (i = limit; i >= 0; i--) {
      if (Price1[i] > Price2[i]) Trend[i] = 90;
      if (Price1[i] < Price2[i]) Trend[i] = 10;
      if (Trend[i+1] > Trend[i] && Trend[i+1] > Trend[i+2]) Trend[i+1] = 10;
      if (Trend[i+1] < Trend[i] && Trend[i+1] < Trend[i+2]) Trend[i+1] = 90;
   }
   for (i = limit; i >= 0; i--) {
      price1 = (High[i] + Low[i] + Close[i])/3;
      price2 = (High[i+1] + Low[i+1] + Close[i+1])/3;
      if (Display_Average_Price_Line == true) AvgPrice[i] = (Price1[i] + Price2[i])/2;
      if (Display_SuperTrend == true) {
         if(Trend[i] == 90) {
            TrendDown[i] = EMPTY_VALUE;
            if(TrendDown[i+1] != EMPTY_VALUE) TrendUp[i+1] = TrendDown[i+1];
            TrendUp[i] = Low[i] - iATR(NULL,0,10,i);// Point*UpDownShift;
            if (price1 < price2 && TrendDown[i+1] != TrendUp[i+1]) TrendUp[i] = TrendUp[i+1];
            if (Close[i] < Close[i+1] && TrendDown[i+1] != TrendUp[i+1]) TrendUp[i] = TrendUp[i+1];
            if (High[i] < High[i+1] && TrendDown[i+1] != TrendUp[i+1]) TrendUp[i] = TrendUp[i+1];
            if (TrendUp[i] < TrendUp[i+1] && TrendUp[i+1] != TrendDown[i+1]) TrendUp[i] = TrendUp[i+1];
         }
         if(Trend[i] == 10) {
            TrendUp[i] = EMPTY_VALUE;
            if(TrendUp[i+1] != EMPTY_VALUE) TrendDown[i+1] = TrendUp[i+1];
            TrendDown[i] = High[i] + iATR(NULL,0,10,i);// Point*UpDownShift;
            if (price1 > price2 && TrendDown[i+1] != TrendUp[i+1]) TrendUp[i] = TrendUp[i+1];
            if (Close[i] > Close[i+1] && TrendDown[i+1] != TrendUp[i+1]) TrendUp[i] = TrendUp[i+1];
            if (Low[i] > Low[i+1] && TrendUp[i+1] != TrendDown[i+1]) TrendDown[i] = TrendDown[i+1];
            if (TrendDown[i] > TrendDown[i+1] && TrendUp[i+1] != TrendDown[i+1]) TrendDown[i] = TrendDown[i+1];
         }
      }
   }
//----

//----
   return(0);
  }
//+------------------------------------------------------------------+
Comments