SuperSR 6_v1
Download script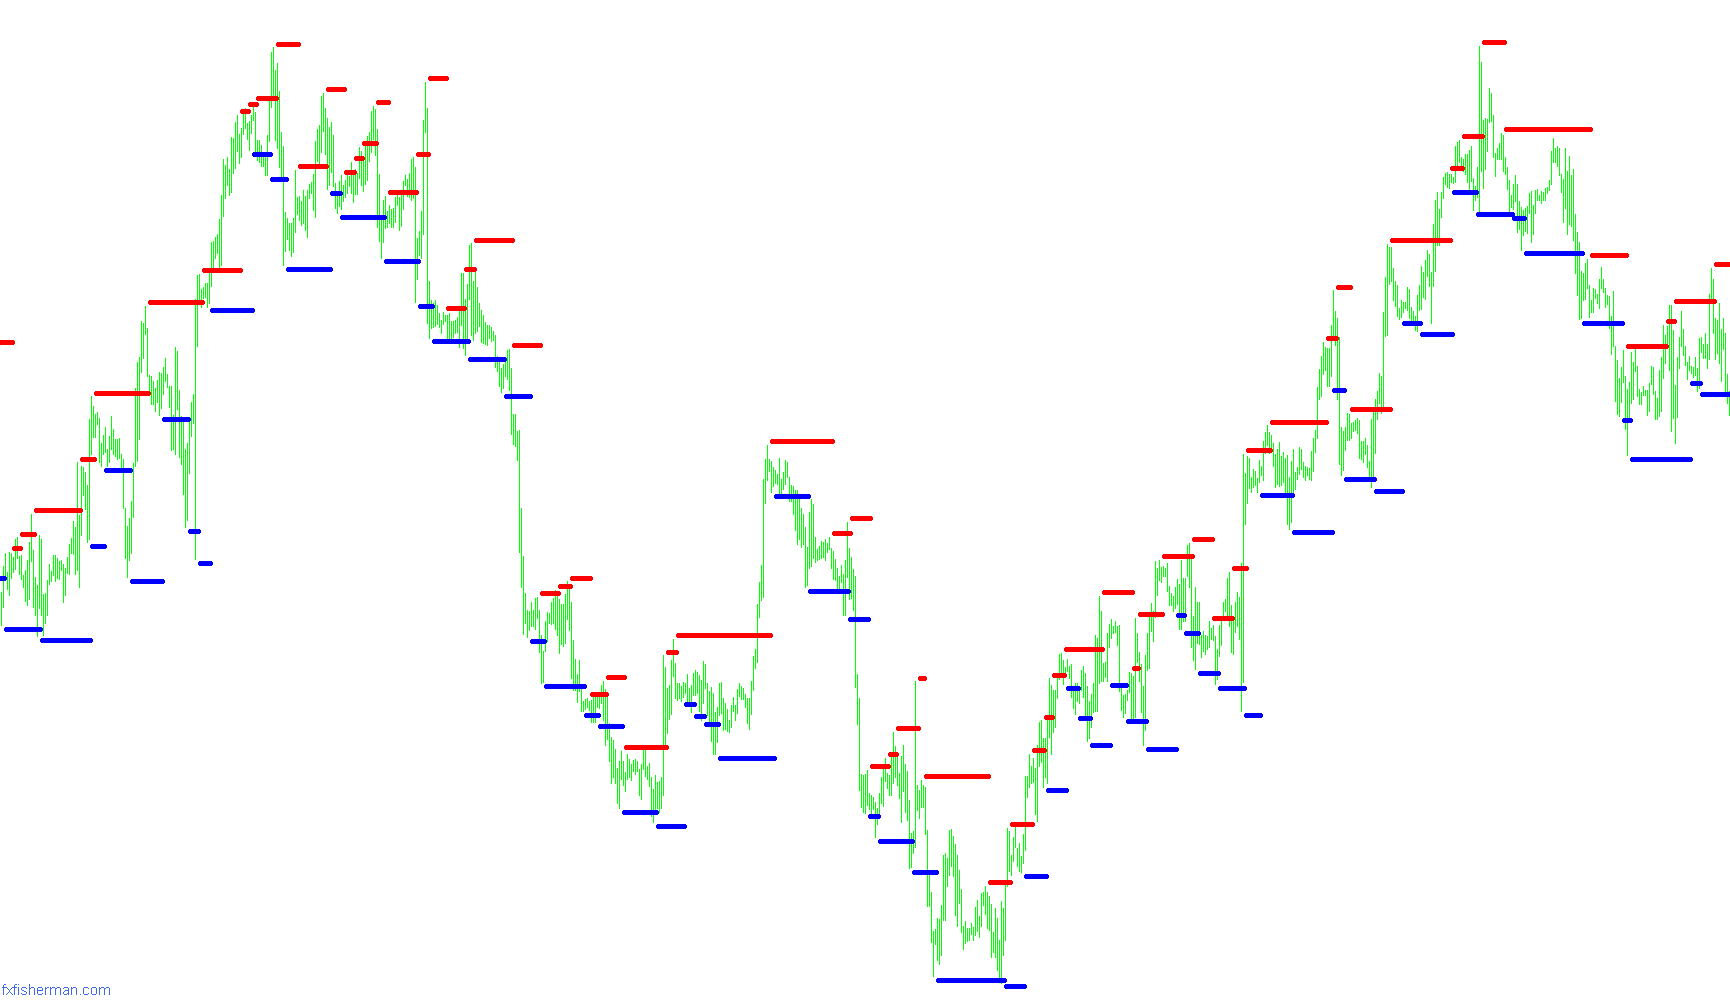
This script is designed to automatically identify and plot key "Support" and "Resistance" levels on your trading chart. These levels represent areas where the price has historically struggled to move past, serving as potential turning points for market trends.
How it Works
The logic operates by scanning historical price movements to find specific structural patterns known as "fractals." Instead of looking at every minor price fluctuation, the tool focuses on significant peaks and valleys:
- Identifying Resistance: The script looks for a high point that is higher than the candles immediately preceding and following it. When such a peak is found, the tool evaluates the distance between this new high and the previous established resistance level. If the gap is large enough (based on your settings), it updates the "Resistance" line to this new high point, marking a new ceiling for the price.
- Identifying Support: Similarly, the script searches for low points that are lower than their neighboring candles. When a new valley is identified, it checks the distance from the previous support level. If the gap meets the required criteria, the "Support" line updates to this new low point, marking a new floor for the price.
Key Features and Behavior
- Dynamic Updating: The script does not just draw lines at random; it carries over the previous level forward until a new, valid fractal is confirmed. This ensures that your chart maintains a continuous visual reference of the most recent significant boundaries.
- Customizable Sensitivity: You can adjust how "strict" the tool is by modifying three main parameters:
- Contract Step: Determines the minimum distance required between a new peak/valley and the previous one before it is recognized as a significant level.
- Precision: Adds a small buffer to the plotted lines to ensure they are clearly visible and not overlapping directly with the price candles.
- Shift Bars: Adjusts the look-back window to determine how many surrounding candles must be considered when identifying a fractal peak or valley.
- Visual Indicators: The tool displays results clearly on your chart using specific colors—traditionally Red for Resistance (selling pressure) and Blue for Support (buying pressure)—allowing for quick visual analysis of market structure.
Miscellaneous
17
Views
0
Downloads
0
Favorites
SuperSR 6_v1
/*-----------------------------+
|			       |
| Shared by www.Aptrafx.com    |
|			       |
+------------------------------*/

//+------------------------------------------------------------------+
//|                SuperSR 6.mq4                                     |
//|                Copyright © 2006  Scorpion@fxfisherman.com        |
//+------------------------------------------------------------------+
#property copyright "FxFisherman.com"
#property link      "http://www.fxfisherman.com"

#property indicator_chart_window
#property indicator_buffers 2
#property indicator_color1 Red
#property indicator_color2 Blue

extern int Contract_Step=150;
extern int Precision=10;
extern int Shift_Bars=1;

//---- buffers
double v1[];
double v2[];
double val1;
double val2;

int init()
  {

   IndicatorBuffers(2);

   SetIndexArrow(0, 159);
   SetIndexStyle(0,DRAW_ARROW,STYLE_SOLID,1,Red);
   SetIndexDrawBegin(0,-1);
   SetIndexBuffer(0, v1);
   SetIndexLabel(0,"Resistance");

   SetIndexArrow(1, 159);
   SetIndexStyle(1,DRAW_ARROW,STYLE_SOLID,1,Blue);
   SetIndexDrawBegin(1,-1);
   SetIndexBuffer(1, v2);
   SetIndexLabel(1,"Support");

   watermark();

   return(0);
  }

int start()
 {
  double gap;
  double contract = (Contract_Step + Precision) * Point;
  int i = Bars;
  int shift;
  bool fractal;
  double price;

  while(i>=0)
   {
    shift = i + Shift_Bars;

    // Resistance
    price = High[shift+2];
    fractal = price >= High[shift+4] &&
              price >= High[shift+3] &&
              price > High[shift+1] &&
              price > High[shift];

    gap = v1[i+1] - price;
    if (fractal && (gap >= contract || gap < 0))
    {
      v1[i] = price + (Precision * Point);
    }else{
      v1[i] = v1[i+1];
    }

    // Support
    price = Low[shift+2];
    fractal = price <= Low[shift+4] &&
              price <= Low[shift+3] &&
              price < Low[shift+1] &&
              price < Low[shift];

    gap = price - v2[i+1];
    if (fractal && (gap >= contract || gap < 0))
    {
      v2[i] = price - (Precision * Point);
    }else{
      v2[i] = v2[i+1];
    }

    i--;
   }
  return(0);
 }

//+------------------------------------------------------------------+

void watermark()
  {
   ObjectCreate("fxfisherman", OBJ_LABEL, 0, 0, 0);
   ObjectSetText("fxfisherman", "fxfisherman.com", 11, "Lucida Handwriting", RoyalBlue);
   ObjectSet("fxfisherman", OBJPROP_CORNER, 2);
   ObjectSet("fxfisherman", OBJPROP_XDISTANCE, 5);
   ObjectSet("fxfisherman", OBJPROP_YDISTANCE, 10);
   return(0);
  }
Comments