Supertrend_v2
Download script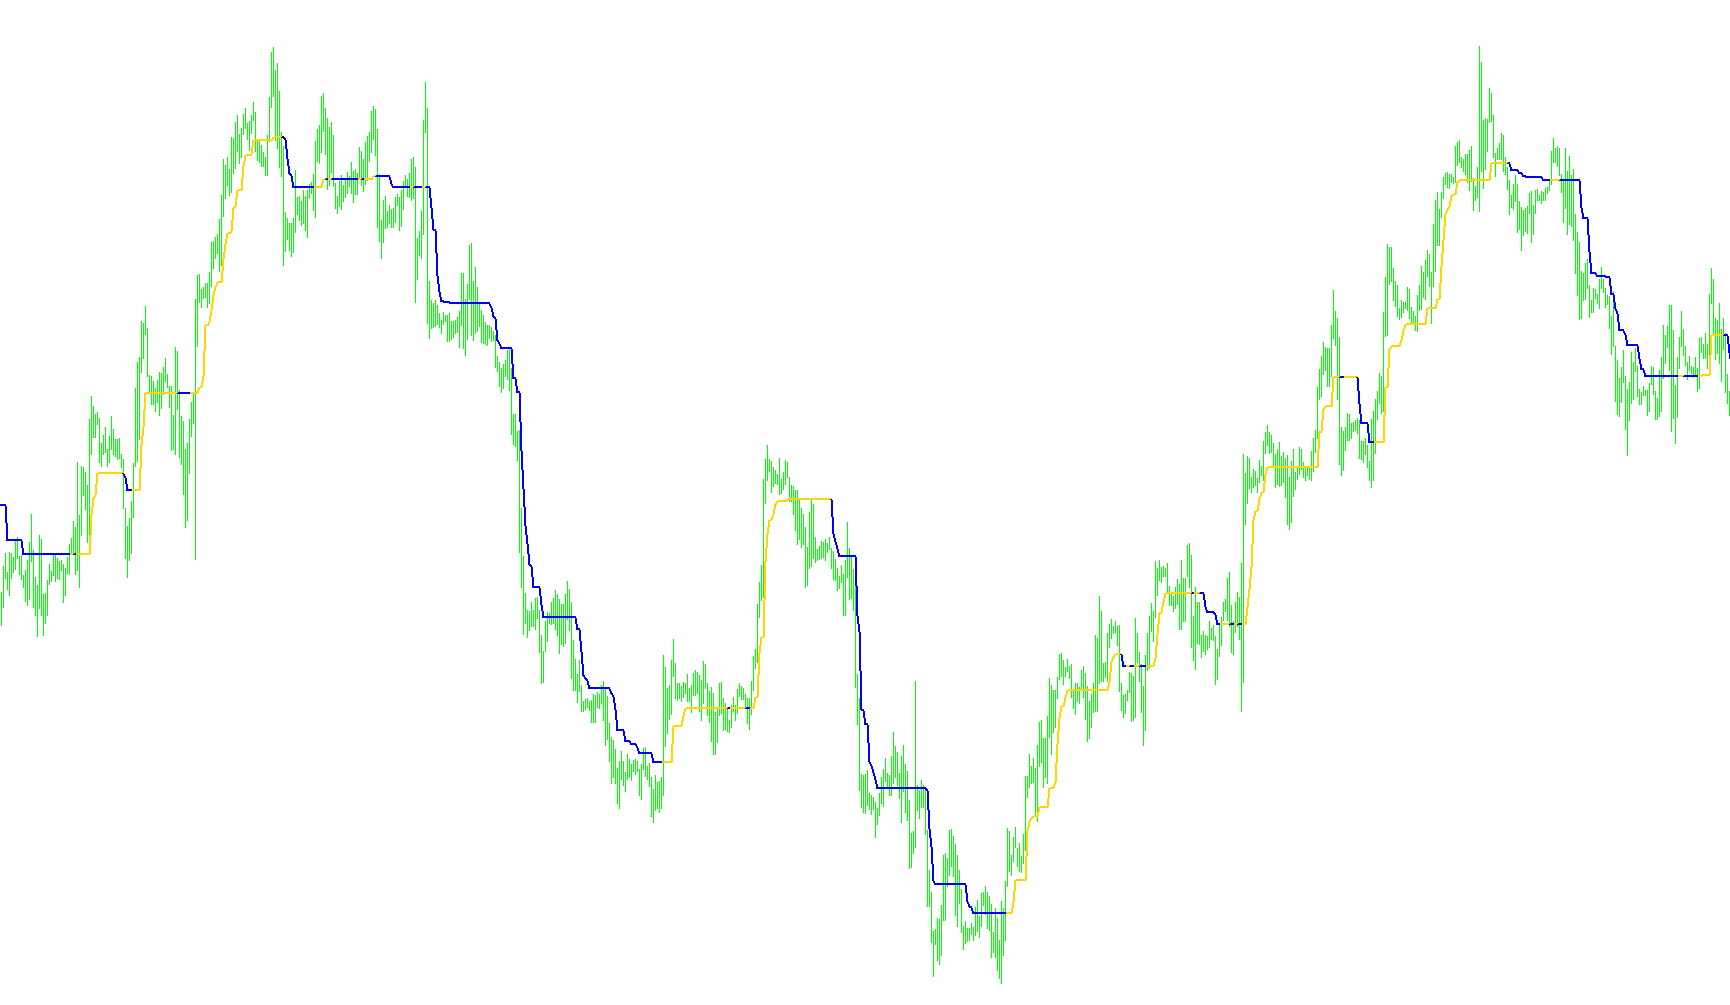
This script is designed to function as a visual trend-following tool for trading charts. Its primary purpose is to identify the current direction of the market—whether it is moving upward or downward—and plot a dynamic line that helps traders visualize these shifts in real-time.
Core Logic and Methodology
The logic behind this tool relies on three main components: momentum measurement, volatility calculation, and trend persistence.
1. Momentum Tracking The script monitors market momentum by comparing current price movements against previous data points. It specifically looks for "crosses," which occur when the market's moving average strength shifts from one state to another. By identifying these pivot points, the script determines when a trend has officially flipped (e.g., transitioning from a bullish move to a bearish move).
2. Volatility Integration To ensure that the trend line reacts realistically to price fluctuations, the script incorporates a volatility measurement. Instead of simply plotting a flat line at a specific price, it uses a mathematical calculation (Average True Range) to determine how much the price typically "swings." This allows the indicator to create a buffer zone around the price action, ensuring the line stays relevant to the actual market volatility.
3. Trend Persistence and Smoothing One of the key features of this logic is its "memory." Rather than constantly jumping up and down with every small tick of price change, the script includes a verification step:
- In an Uptrend: The tool ensures that the new trend line never moves downward. It only updates if the price pushes the trend higher, creating a smooth, ascending curve.
- In a Downtrend: Conversely, the tool ensures the trend line never moves upward. It only updates if the price drops lower, resulting in a steady descending curve.
Visual Representation
The script produces two distinct visual elements on your chart:
- Upward Trend: Represented by a green line, indicating a sustained bullish environment where price momentum is pushing higher.
- Downward Trend: Represented by a red line, indicating a sustained bearish environment where price momentum is pushing lower.
Summary for the User
In simple terms, this script filters out "market noise" by calculating the average strength and volatility of recent price movements. It then draws a line on your chart that follows the general path of the market. Because it is programmed to ignore minor fluctuations and only move in the direction of the primary trend, it serves as a guide for identifying the prevailing market direction at any given moment.
/*-----------------------------+
|			       |
| Shared by www.Aptrafx.com    |
|			       |
+------------------------------*/

//+------------------------------------------------------------------+
//|                                                   Supertrend.mq4 |
//|                      Copyright © 2006, MetaQuotes Software Corp. |
//|                                        http://www.metaquotes.net |
//+------------------------------------------------------------------+
#property copyright "Copyright © 2006, MetaQuotes Software Corp."
#property link      "http://www.metaquotes.net"

#property indicator_chart_window
#property indicator_buffers 4
#property indicator_color1 Lime
#property indicator_color2 Red


double TrendUp[];
double TrendDown[];
int st = 0;
//extern int SlowerEMA = 6;


//+------------------------------------------------------------------+
//| Custom indicator initialization function|
//+------------------------------------------------------------------+
int init()
 {
//---- indicators

  SetIndexStyle(0, DRAW_LINE, STYLE_SOLID, 2);
  SetIndexBuffer(0, TrendUp);
  SetIndexStyle(1, DRAW_LINE, STYLE_SOLID, 2);
  SetIndexBuffer(1, TrendDown);

  /*SetIndexStyle(0, DRAW_ARROW, EMPTY);
  SetIndexArrow(0, 159);
  SetIndexBuffer(0, TrendUp);
  SetIndexStyle(1, DRAW_ARROW, EMPTY);
  SetIndexArrow(1, 159);
  SetIndexBuffer(1, TrendDown);*/

  /*for(int i = 0; i < Bars; i++) {
     TrendUp[i] = NULL;
     TrendDown[i] = NULL;
  }*/
//----
  return(0);
 }
//+------------------------------------------------------------------+
//| Custor indicator deinitialization function|
//+------------------------------------------------------------------+
int deinit()
 {
//----
  /*for(int i = 0; i < Bars; i++) {
     TrendUp[i] = NULL;
     TrendDown[i] = NULL;
  }*/
//----
  return(0);
 }
//+------------------------------------------------------------------+
//| Custom indicator iteration function|
//+------------------------------------------------------------------+
int start()
 {

  int limit, i, counter;
  double Range, AvgRange, cciTrendNow, cciTrendPrevious, var;

  int counted_bars = IndicatorCounted();
//---- check for possible errors
  if(counted_bars < 0) return(-1);
//---- last counted bar will be recounted
  if(counted_bars > 0) counted_bars--;

  limit=Bars-counted_bars;

  for(i = limit; i >= 0; i--) {
     cciTrendNow = iCCI(NULL, 0, 50, PRICE_TYPICAL, i);
     cciTrendPrevious = iCCI(NULL, 0, 50, PRICE_TYPICAL, i+1);

     //st = st * 100;


     counter = i;
     Range = 0;
     AvgRange = 0;
     for (counter = i; counter >= i-9; counter--) {
        AvgRange = AvgRange + MathAbs(High[counter]-Low[counter]);
     }
     Range = AvgRange/10;
     if (cciTrendNow >= st && cciTrendPrevious < st) {
        TrendUp[i+1] = TrendDown[i+1];
     }

     if (cciTrendNow <= st && cciTrendPrevious > st) {
        TrendDown[i+1] = TrendUp[i+1];
     }

     if (cciTrendNow >= st) {
        TrendUp[i] = Low[i] - iATR(NULL, 0, 5, i);
        if (TrendUp[i] < TrendUp[i+1]) {
           TrendUp[i] = TrendUp[i+1];
        }
     }
     else if (cciTrendNow <= st) {
        TrendDown[i] = High[i] + iATR(NULL, 0, 5, i);
        if (TrendDown[i] > TrendDown[i+1]) {
           TrendDown[i] = TrendDown[i+1];
        }
     }
  }

//----

//----
  return(0);
 }

//+------------------------------------------------------------------+
Comments