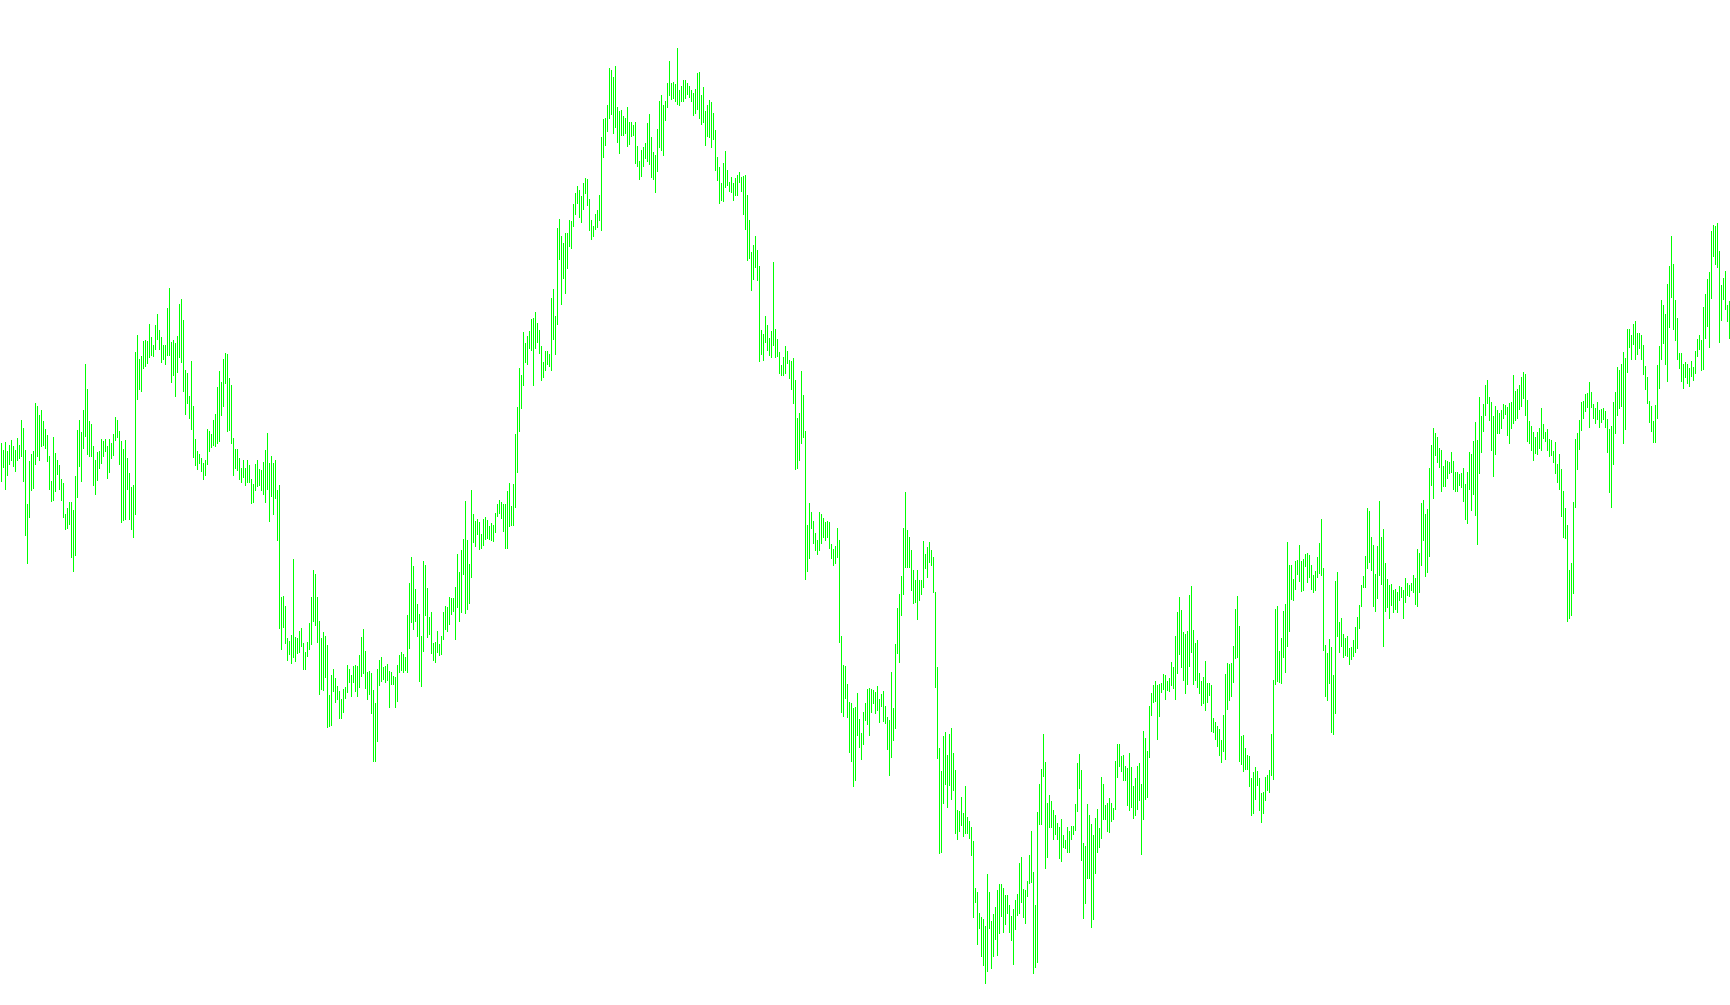
This script is designed to analyze price movements on a specific timeframe (the 1-hour chart) by identifying and calculating the distance traveled between peaks and valleys using a technical indicator known as the "Zigzag."
Core Functionality
The primary purpose of this tool is to calculate the total cumulative distance covered by the Zigzag line between two specific dates provided by the user. Instead of simply looking at the direct distance from the start point to the end point, the script measures every individual "zig" and "zag" along the path to determine the total "travel" distance.
Step-by-Step Logic Breakdown
1. Environment Check Before performing any calculations, the script verifies that the user is viewing the 1-hour chart. If the timeframe is different, it provides an alert and stops execution to ensure the data remains consistent with the intended analysis.
2. Identifying the Start and End Points The script looks at the start date and the stop date provided in the settings. It then searches backward through the historical data to find the very first and very last "Zigzag points" (the peaks or valleys) that occurred within those dates.
3. Coordinate Mapping To ensure accuracy, the script calculates the mathematical coordinates of these specific points. It identifies the exact price level and time for both the first significant movement at the beginning of the period and the final movement at the end of the period.
4. Cumulative Distance Calculation This is the main logic of the script. Rather than subtracting the start price from the end price, the script "walks" through every Zigzag point between your chosen dates:
- It identifies every peak and valley in sequence.
- It calculates the absolute distance of each individual movement.
- It adds all these individual distances together into a running total.
5. Final Reporting Once the calculation is complete, the script converts this total distance into "points" (the smallest price unit of the currency pair). It then prints a summary to the terminal, showing:
- The starting price and time.
- The ending price and time.
- The total cumulative distance traveled across all peaks and valleys in the specified period.
Summary for the User
Think of this script like a fitness tracker for a stock or currency chart. If you want to know how far a hiker traveled, you don't just measure the straight line from the start to the finish; you measure every turn they took. This script does exactly that—it calculates the "total mileage" of price action between two dates by following every twist and turn of the Zigzag indicator.
//+------------------------------------------------------------------+
//|                                                 ZigzagPoints.mq4 |
//|                      Copyright © 2007, MetaQuotes Software Corp. |
//|                                        http://www.metaquotes.ru/ |
//+------------------------------------------------------------------+
#property copyright "Copyright © 2007, MetaQuotes Software Corp."
#property link      "http://www.metaquotes.ru/"

#property show_inputs

extern string startDate="2007.10.01";
extern string stopDate="2007.12.16";

//+------------------------------------------------------------------+
//| script program start function                                    |
//+------------------------------------------------------------------+
int start()
  {
//----
   if (Period()!=PERIOD_H1)
      {
      Alert("Çàïóñêàòü íà ÷àñîâêàõ!!!");
      return;
      }

   int i,first,next,firstPointBar,lastPointBar;
   firstPointBar=iBarShift(NULL,0,StrToTime(startDate));
   lastPointBar=iBarShift(NULL,0,StrToTime(stopDate));
   // íàéòè ïåðâóþ òî÷êó
   // firstPointBar=
   double breaking=0;
   i=firstPointBar;
   while (breaking==0.0)
      {
      breaking=iCustom(NULL,0,"Zigzag",12,5,3,0,i);
      i++;
      }
   i--;
   first=i;
   Print("Time=",TimeToStr(Time[first]),"   price=",breaking);

   breaking=0.0;
   i=first-1;
   while (breaking==0.0)
      {
      breaking=iCustom(NULL,0,"Zigzag",12,5,3,0,i);
      i--;
      }
   i++;
   next=i;
   Print("Time=",TimeToStr(Time[next]),"   price=",breaking);

   double a,b;
   double y1,y2;
   y1=iCustom(NULL,0,"Zigzag",12,5,3,0,first);
   y2=iCustom(NULL,0,"Zigzag",12,5,3,0,next);
   a=(y1-y2)/(first-next);
   b=y1-a*first;

   double startPrice=a*firstPointBar+b;

//***********************************************************************************************************
   // íàéòè âòîðóþ òî÷êó
   // lastPointBar=
   breaking=0;
   i=lastPointBar;
   while (breaking==0.0)
      {
      breaking=iCustom(NULL,0,"Zigzag",12,5,3,0,i);
      i++;
      }
   i--;
   first=i;
   Print("Time=",TimeToStr(Time[first]),"   price=",breaking);

   breaking=0.0;
   i=first-1;
   while (breaking==0.0)
      {
      breaking=iCustom(NULL,0,"Zigzag",12,5,3,0,i);
      i--;
      }
   i++;
   next=i;
   Print("Time=",TimeToStr(Time[next]),"   price=",breaking);

   y1=iCustom(NULL,0,"Zigzag",12,5,3,0,first);
   y2=iCustom(NULL,0,"Zigzag",12,5,3,0,next);
   a=(y1-y2)/(first-next);
   b=y1-a*first;

   double stopPrice=a*lastPointBar+b;
   Print("Ïåðâàÿ òî÷êà   : âðåìÿ=",TimeToStr(Time[firstPointBar]),"  price=",startPrice);
   Print("Ïîñëåäíÿÿ òî÷êà: âðåìÿ=",TimeToStr(Time[lastPointBar]),"  price=",stopPrice);

   //  ó íàñ åñòü êîîðäèíàòû ïåðâîé è ïîñëåäíåé òî÷êè. òåïåðü ìîæíî äâèãàòüñÿ ìåæäó íèìè

   double Summ; //  ñóììà â ïóíêòàõ
   double lastpeak=startPrice;
   double currZZ;
   for (i=firstPointBar;i>=lastPointBar;i--)
      {
      currZZ=iCustom(NULL,0,"Zigzag",12,5,3,0,i);
      if (currZZ!=0)
         {
         Summ+=MathAbs(currZZ-lastpeak);
         lastpeak=currZZ;
         }
      }
   double point=MarketInfo(Symbol(),MODE_POINT);
   Summ/=point;
   Print("Âñåãî ïåðåïàä ìåæäó âåðøèíàìè Zigzag\'a íà çàäàííîì ó÷àñòêå ñîñòàâèë ",DoubleToStr(Summ,0),"  ïóíêòîâ");
//----
   return(0);
  }
//+------------------------------------------------------------------+
Comments