Support and Resistance (Barry)_002
Download script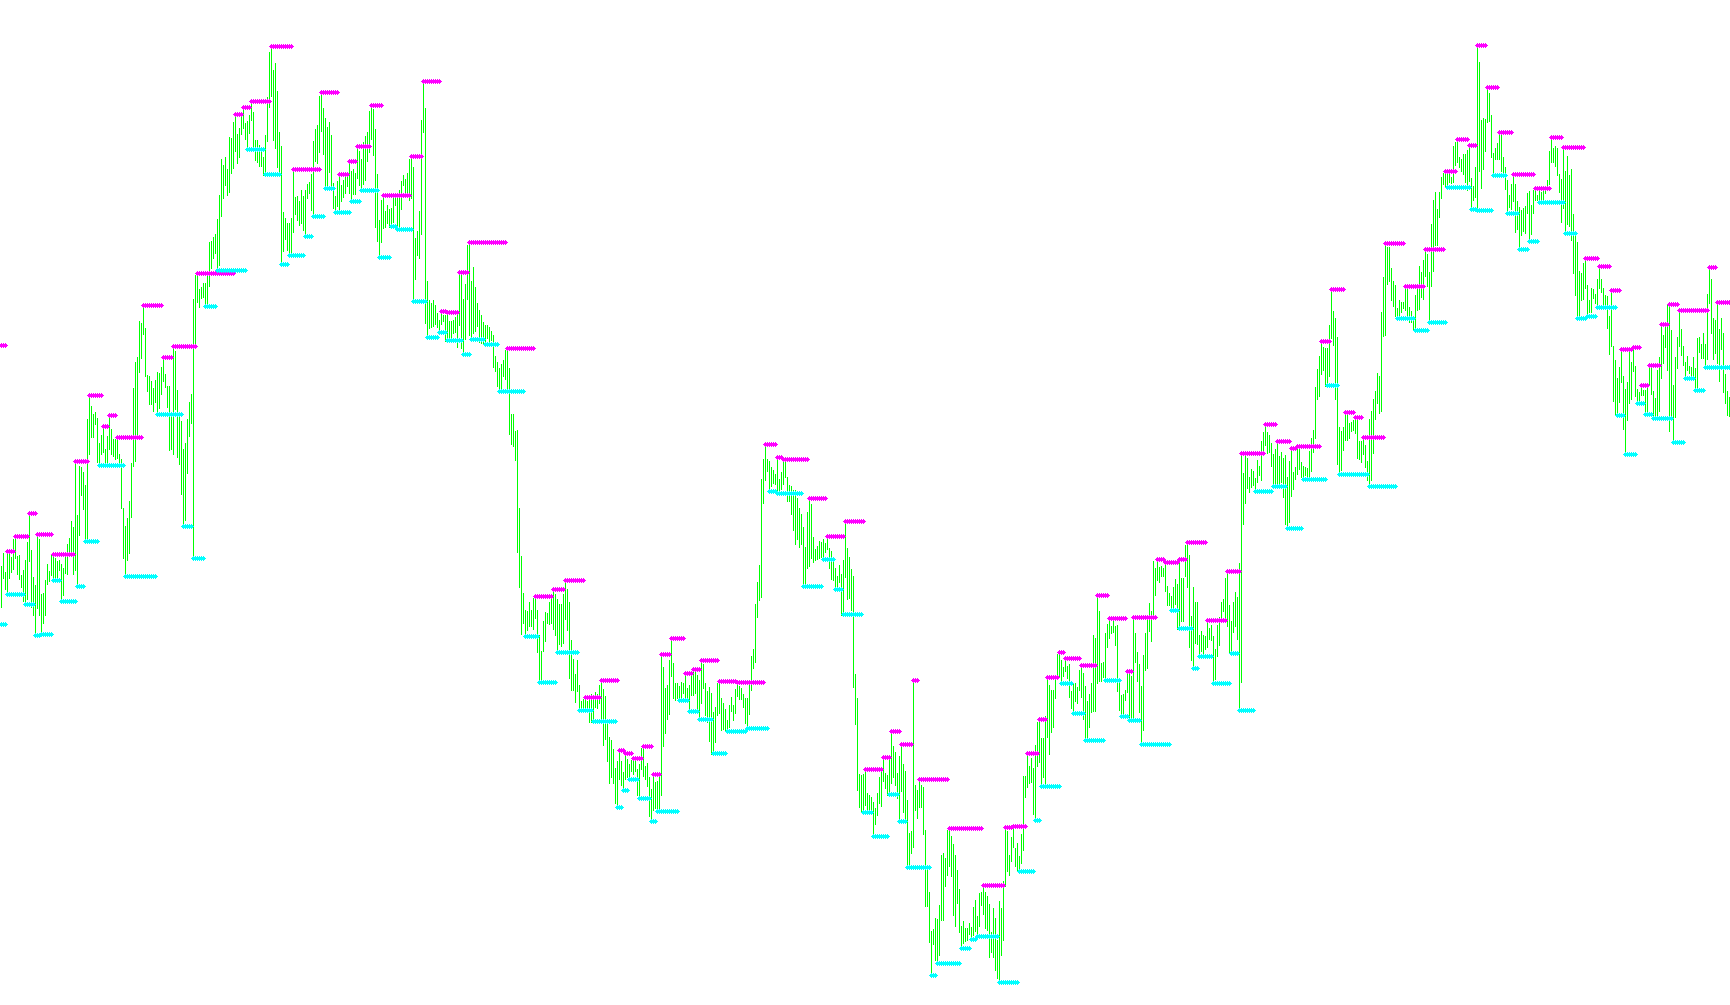
This tool is designed to help traders visually identify key structural levels in the financial markets, specifically Support and Resistance zones. By analyzing historical price action, it highlights areas where the market has historically struggled to move past or has found a "floor" and "ceiling."
How the Logic Works
The script functions by scanning your price history to locate specific turning points in the market's movement. It focuses on two main types of price behaviors:
- Resistance Levels (Ceilings): The tool looks for peaks in price action. When it identifies a point where the price reached a high and then turned downward, it marks this as a potential resistance zone. On your chart, these are highlighted to show you where sellers have historically stepped in to push prices back down.
- Support Levels (Floors): Simultaneously, the tool scans for troughs in price action. It identifies points where the price dropped to a low and then bounced back upward. These are marked as support zones, representing areas where buyers have historically entered the market to prevent the price from falling further.
Dynamic Tracking
Rather than just marking isolated dots, the logic is designed to "carry over" these levels. When a new significant peak or trough is discovered, the tool updates its memory. This allows the indicator to maintain a continuous visual line, making it easier for you to see how a specific support or resistance level persists across different periods of time.
Visual Presentation
To keep your workspace clear and organized, the script distinguishes between these two forces using color-coded markers:
- Magenta markers are used to designate Resistance levels.
- Aqua markers are used to designate Support levels.
By providing these visual cues, the script allows you to quickly see where the market is likely to react, helping you identify potential areas for entry or exit based on historical price behavior.
//+------------------------------------------------------------------+
//|                Support and Resistance                            |
//|                Copyright © 2004  Barry Stander                   |
//|                http://myweb.absa.co.za/stander/4meta/            |
//+------------------------------------------------------------------+
#property copyright "Click here: Barry Stander"
#property link      "http://myweb.absa.co.za/stander/4meta/"

#property indicator_chart_window
#property indicator_buffers 2
#property indicator_color1 Magenta
#property indicator_color2 Aqua

//---- buffers
double v1[];
double v2[];
double val1;
double val2;
int i;

int init()
  {

  IndicatorBuffers(2);

//---- drawing settings
 SetIndexArrow(0, 119);
 SetIndexArrow(1, 119);

   SetIndexStyle(0,DRAW_ARROW,STYLE_DOT,0,Magenta);
   SetIndexDrawBegin(0,i-1);
   SetIndexBuffer(0, v1);
   SetIndexLabel(0,"Resistance");


   SetIndexStyle(1,DRAW_ARROW,STYLE_DOT,0,Aqua);
   SetIndexDrawBegin(1,i-1);
   SetIndexBuffer(1, v2);
   SetIndexLabel(1,"Support");

   return(0);
  }

int start()
  {

   i=Bars;
   while(i>=0)
     {

val1 = iFractals(NULL, 0, MODE_UPPER,i);
 if (val1 > 0)
   v1[i]=High[i];
    else
      v1[i] = v1[i+1];

val2 = iFractals(NULL, 0, MODE_LOWER,i);
 if (val2 > 0)
   v2[i]=Low[i];
      else
      v2[i] = v2[i+1];

      i--;
     }
   return(0);
  }

//+------------------------------------------------------------------+
Comments