WPRfast_v2
Download script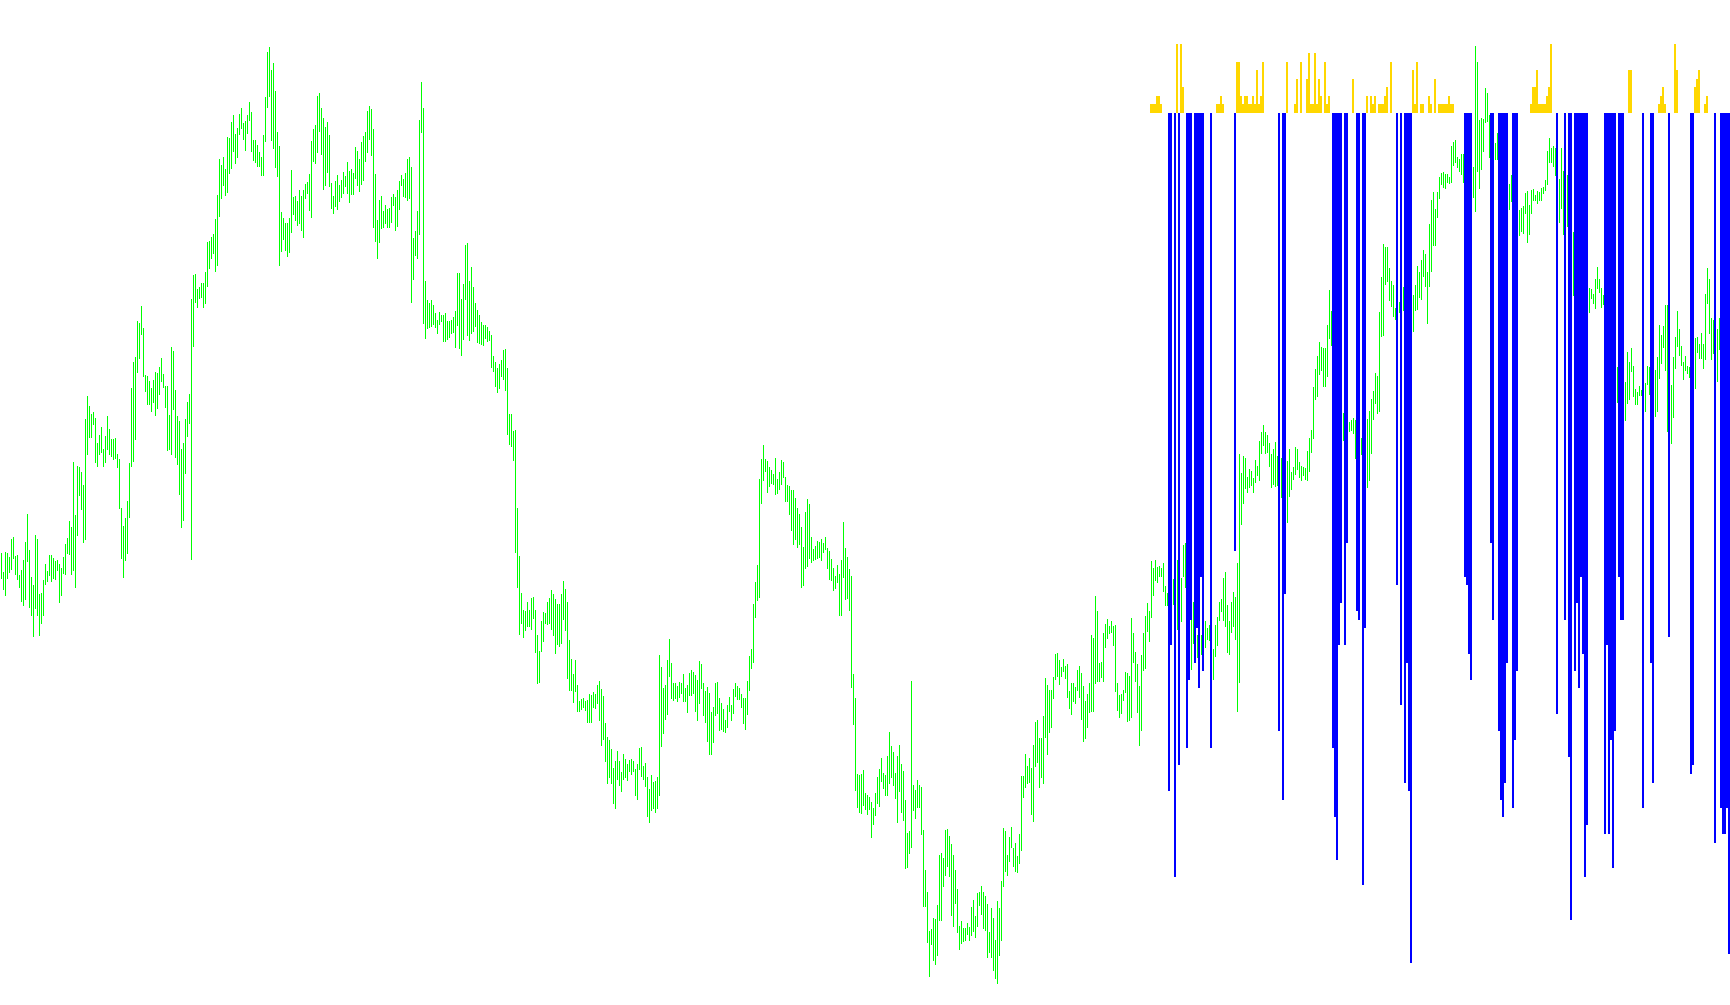
This tool is a specialized visual indicator designed to help traders identify potential extremes in price momentum. It operates by analyzing the Williams Percent Range (WPR), a common technical analysis tool used to determine overbought or oversold conditions, but it introduces specific logic to refine how these signals are displayed on your chart.
Core Mechanics
The script functions by monitoring the market's price movement over a set period. It focuses on identifying when the price is moving with significant strength in one direction compared to its recent history. To achieve this, it performs three main steps:
- Momentum Calculation: The tool first calculates the standard WPR value based on your chosen timeframe. It then squares this value and scales it down, which serves to emphasize larger moves while smoothing out minor fluctuations.
- Threshold Filtering: Unlike standard indicators that show every tiny movement, this script uses two specific "boundaries" (defined by the $n1$ and $n2$ parameters). It effectively ignores "noise" in the middle of the range, only reacting when the momentum pushes into extreme zones.
- Directional Visuals: The logic separates these extremes into two distinct visual components:
- Upward Momentum: When the calculated strength exceeds the upper boundary ($n1$), it generates a positive value represented in blue.
- Downward Momentum: When the calculated strength drops below the lower boundary ($n2$), it generates a negative value represented in red.
How it appears on your chart
The indicator is displayed in a separate window at the bottom of your trading platform. Instead of a simple moving line, it uses a histogram style. This means you will see vertical bars that grow upward (Blue) or downward (Red).
By looking at these bars, a trader can quickly see when the market is reaching high-velocity states. If the bars are absent, the market is in a "neutral" zone; if large bars appear, it signals that the price is experiencing significant momentum in that specific direction. This allows for a cleaner visual experience by filtering out the majority of market movements and highlighting only the most significant trends.
 //+------------------------------------------------------------------+
//|                                                      WPRfast.mq4 |
//|                                        Ramdass - Conversion only |
//+------------------------------------------------------------------+
#property  copyright "Author - OlegVS"
//----
#property indicator_separate_window
#property indicator_minimum -1.0
#property indicator_maximum  1.0
#property indicator_buffers 2
#property indicator_color1 Blue
#property indicator_color2 Red
//---- input parameters
extern int P = 9;
extern int n1 = 9;
extern int n2 = 49;
extern int CountBars = 300;
//---- buffers
double Up[];
double Down[];
//+------------------------------------------------------------------+
//| Custom indicator initialization function                         |
//+------------------------------------------------------------------+
int init()
  {
//---- indicator line
   IndicatorBuffers(2);
   SetIndexStyle(0, DRAW_HISTOGRAM, STYLE_SOLID, 2);
   SetIndexStyle(1, DRAW_HISTOGRAM, STYLE_SOLID, 2);
   SetIndexBuffer(0, Up);
   SetIndexBuffer(1, Down);
//---- name for DataWindow and indicator subwindow label
   IndicatorShortName("WPRfast(" + P + ", " + n1 + ", " + n2 + ")");
   SetIndexLabel(0, "WPRfastUp(" + P + ", " + n1 + ", " + n2 + ")");
   SetIndexLabel(1, "WPRfastDown(" + P + ", " + n1 + ", " + n2 + ")");
//----
   if(CountBars > Bars)
       CountBars = Bars;
   SetIndexDrawBegin(0, Bars - CountBars + P);
   SetIndexDrawBegin(1, Bars - CountBars + P);
//----
   return(0);
  }
//+------------------------------------------------------------------+
//| WPRfast                                                          |
//+------------------------------------------------------------------+
int start()
  {
   int i, counted_bars = IndicatorCounted();
   double V1, V2;
//----
   if(CountBars <= P)
       return(0);
//---- initial zero
   if(counted_bars < 1)
     {
       for(i = 1; i <= P; i++)
           Up[CountBars-i] = 0.0;
       for(i = 1; i <= P; i++)
           Down[CountBars-i] = 0.0;
     }
//----
   i = CountBars - P - 1;
   while(i >= 0)
     {
       Down[i] = 0.0;
       Up[i] = 0.0;
       V1 = iWPR(NULL, 0, P, i)*iWPR(NULL, 0, P, i) / 100;
       V2 = MathCeil(V1);
       if(V2 < n1)
         {
           Up[i] = V2;
         }
       if(V2 > n2)
         {
           Down[i] = -(V2);
         }
       i--;
     }
   return(0);
  }
//+------------------------------------------------------------------+
Comments