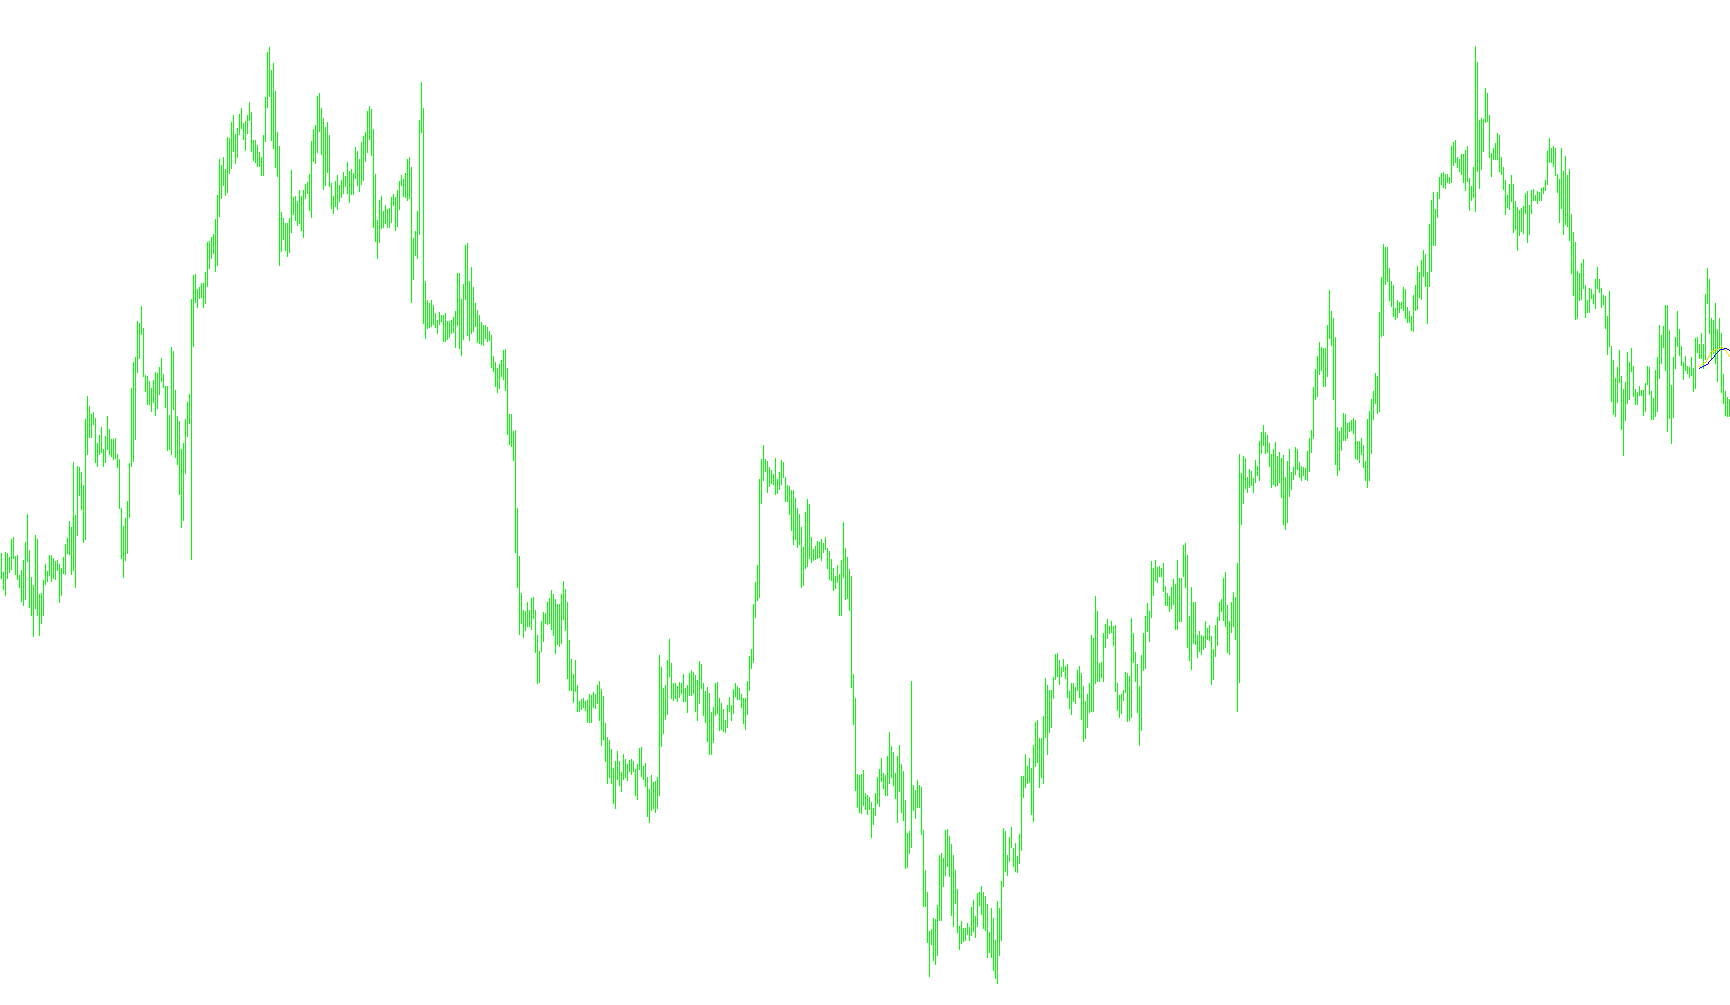
This tool is a custom technical analysis indicator designed for the MetaTrader 4 platform. It provides traders with a visual representation of price momentum by calculating and displaying two distinct moving averages on the trading chart simultaneously.
Core Functionality
The script operates by analyzing historical price data to identify trends based on "Linear Weighted Moving Averages" (LWMA). Unlike standard simple averages, this method gives more importance to recent price actions, making it highly responsive to current market shifts. The indicator uses the "Opening Price" of each candle as its primary data point to determine these values.
How the Logic Works
The script generates two unique lines on your chart to help interpret market behavior:
- Primary Trend Line: This line represents a standard Linear Weighted Moving Average based on a user-defined period (defaulting to 34). It provides a baseline for the current price direction.
- Smoothed Momentum Line: This is a more complex calculation. Instead of looking at just one point in time, the script captures the values of the moving average from the current candle and the five preceding candles. It then calculates the mathematical average of these six consecutive values.
Purpose and Visual Representation
By layering these two lines together, the tool allows you to see the relationship between immediate price momentum and a slightly "smoothed" version of that same data.
- The Turquoise Line represents the primary moving average.
- The Red Line represents the averaged multi-candle calculation.
Traders use this logic to observe how the current trend relates to very recent history. When these two lines move in harmony, it can signal a strong established trend; when they begin to diverge or interact, it may suggest a shift in market momentum or a potential change in price direction.
//+------------------------------------------------------------------+
//|                                                         t_ma.mq4 |
//|                                                                  |
//|                                                                  |
//+------------------------------------------------------------------+
#property copyright ""
#property link      ""

#property indicator_chart_window
#property indicator_buffers 2
#property indicator_color1 Turquoise
#property indicator_color2 Red
//---- buffers
double ExtMapBuffer1[];
double ExtMapBuffer2[];
extern int MA_Period=34;
//+------------------------------------------------------------------+
//| Custom indicator initialization function                         |
//+------------------------------------------------------------------+
int init()
  {
//---- indicators
   SetIndexStyle(0,DRAW_LINE);
   SetIndexBuffer(0,ExtMapBuffer1);

   SetIndexStyle(1,DRAW_LINE);
   SetIndexBuffer(1,ExtMapBuffer2);
//----
   return(0);
  }
//+------------------------------------------------------------------+
//| Custom indicator deinitialization function                       |
//+------------------------------------------------------------------+
int deinit()
  {
//----

//----
   return(0);
  }
//+------------------------------------------------------------------+
//| Custom indicator iteration function                              |
//+------------------------------------------------------------------+
int start()
  {
   int  i,  counted_bars=IndicatorCounted();
//----
 for(i=10;i>=0;i--)
 {
 ExtMapBuffer1[i]=iMA(NULL,0,MA_Period,0,MODE_LWMA,PRICE_OPEN,i);
 ExtMapBuffer2[i]=
 (iMA(NULL,0,MA_Period,0,MODE_LWMA,PRICE_OPEN,i)
  +iMA(NULL,0,MA_Period,0,MODE_LWMA,PRICE_OPEN,i+1)
    +iMA(NULL,0,MA_Period,0,MODE_LWMA,PRICE_OPEN,i+2)
      +iMA(NULL,0,MA_Period,0,MODE_LWMA,PRICE_OPEN,i+3)
        +iMA(NULL,0,MA_Period,0,MODE_LWMA,PRICE_OPEN,i+4)
          +iMA(NULL,0,MA_Period,0,MODE_LWMA,PRICE_OPEN,i+5)
            )/6;
 }
//----
   return(0);
  }
//+------------------------------------------------------------------+
Comments