t3_Aroon_Horn
Download script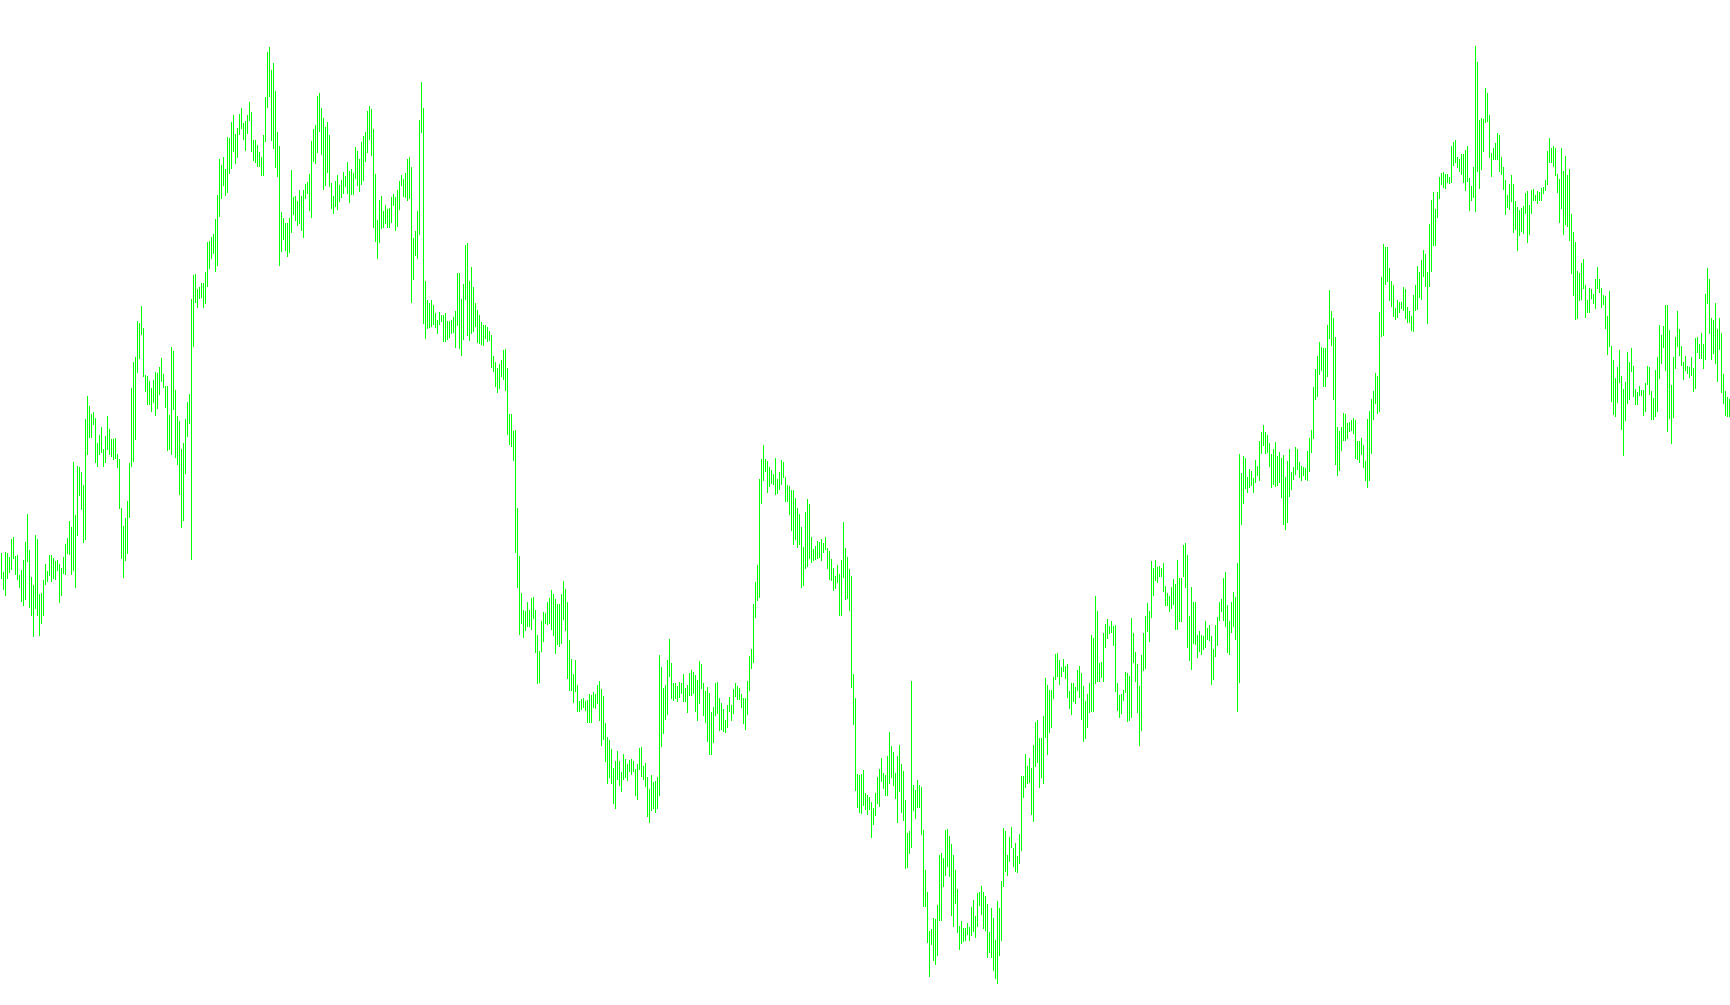
This technical indicator is designed to provide traders with a smoothed, high-precision visualization of market momentum and trend strength. It functions by combining two distinct mathematical concepts: the Aroon Horn logic and the T3 Moving Average smoothing technique.
Core Logic Overview
The primary objective of this script is to filter out "market noise"—the small, erratic price fluctuations that can often lead to false signals—to reveal the underlying trend. It achieves this through a multi-layered calculation process:
- Data Sourcing (Aroon Horn): The script first pulls raw data from the "Aroon Horn" indicator. This base logic is typically used to determine whether a market is trending upward, downward, or remaining in a sideways consolidation phase by analyzing price highs and lows over a specific period.
- Advanced Smoothing (T3 Filter): Instead of using a standard moving average, the script passes the Aroon Horn data through a T3 smoothing algorithm. The T3 is known for being significantly faster and more responsive than traditional averages while maintaining a much smoother line. It uses a complex weighting system to reduce "overshoot" (where a price moves too far in one direction before correcting).
- Dual-Stream Analysis: The script calculates two separate lines simultaneously:
- Blue Line: Represents the primary smoothed momentum of the first data stream.
- Red Line: Represents the primary smoothed momentum of the second data stream.
How It Works for the User
By calculating these two smoothed values, the indicator provides a visual representation of trend direction and intensity. Because both lines are processed through the T3 filter with specific coefficients (defined by the "b" parameter), they react to price changes in a balanced way.
When these lines move in synchronization, it suggests a strong, established trend. When they diverge or flatten out, it provides a visual cue that the market momentum may be shifting or entering a period of indecision. Essentially, this script takes raw trend data and "polishes" it so that traders can see the true movement of the market more clearly.
//+-------------------------------------------------------------------------+
//| t3_Aroon_Horn.mq4                                                       |
//| Copyright © 2005,                                                       |
//| http://finance.groups.yahoo.com/group/MetaTrader_Experts_and_Indicators/|
//+-------------------------------------------------------------------------+
#property copyright "Copyright © 2005,"
#property link      "http://finance.groups.yahoo.com/group/MetaTrader_Experts_and_Indicators/"

#property indicator_separate_window
#property indicator_buffers 2
#property indicator_color1 Blue
#property indicator_color2 Red
#property indicator_level1 0

extern int AroonHornPeriod = 5.0;
extern int T3_Period = 5.0;
extern double b = 0.500;

double MapBuffer[];
double e1,e2,e3,e4,e5,e6;
double c1,c2,c3,c4;
double n,w1,w2,b2,b3;
double MapBuffer1[];
double ae1,ae2,ae3,ae4,ae5,ae6;
double ac1,ac2,ac3,ac4;
double an,aw1,aw2,ab2,ab3;
double sub1,sub2;

//+------------------------------------------------------------------+
//| Custom indicator initialization function                         |
//+------------------------------------------------------------------+
int init()
  {
//---- indicators setting
    SetIndexStyle(0,DRAW_LINE,STYLE_SOLID,1,Blue);
    SetIndexStyle(1,DRAW_LINE,STYLE_SOLID,1,Red);
    IndicatorDigits(MarketInfo(Symbol(),MODE_DIGITS));
    IndicatorShortName("t3_Aroon_Horn "+T3_Period);

    SetIndexBuffer(0,MapBuffer);
    SetIndexBuffer(1,MapBuffer1);

//---- variable reset

    e1=0; e2=0; e3=0; e4=0; e5=0; e6=0;
    c1=0; c2=0; c3=0; c4=0;
    n=0;
    w1=0; w2=0;
    b2=0; b3=0;

    b2=b*b;
    b3=b2*b;
    c1=-b3;
    c2=(3*(b2+b3));
    c3=-3*(2*b2+b+b3);
    c4=(1+3*b+b3+3*b2);
    n=T3_Period;

    if (n<1) n=1;
    n = 1 + (0.5*(n-1));
    w1 = 2 / (n + 1);
    w2 = 1 - w1;

    ae1=0; ae2=0; ae3=0; ae4=0; ae5=0; ae6=0;
    ac1=0; ac2=0; ac3=0; ac4=0;
    an=0;
    aw1=0; aw2=0;
    ab2=0; ab3=0;

    ab2=b*b;
    ab3=ab2*b;
    ac1=-ab3;
    ac2=(3*(ab2+ab3));
    ac3=-3*(2*ab2+b+ab3);
    ac4=(1+3*b+ab3+3*ab2);
    an=T3_Period;

    if (an<1) an=1;
    an = 1 + (0.5*(an-1));
    aw1 = 2 / (an + 1);
    aw2 = 1 - aw1;

//----
    return(0);
  }

//+------------------------------------------------------------------+
//| Custom indicator iteration function                              |
//+------------------------------------------------------------------+
int start()
  {
   int limit=500;

//---- indicator calculation

    for(int i=limit; i>=0; i--)
    {

        sub1=iCustom(Symbol(), 0, "Aroon_Horn",AroonHornPeriod,0,i);

        e1 = ((w1*sub1) + w2*e1);
        e2 = ((w1*e1) + w2*e2);
        e3 = ((w1*e2) + w2*e3);
        e4 = ((w1*e3) + w2*e4);
        e5 = ((w1*e4) + w2*e5);
        e6 = ((w1*e5) + w2*e6);

        MapBuffer[i]=((((c1*e6) + c2*e5) + c3*e4) + c4*e3)*1000;

        sub2=iCustom(Symbol(), 0, "Aroon_Horn",AroonHornPeriod,1,i);

        ae1 = (aw1*sub2) + (aw2*ae1);
        ae2 = (aw1*ae1) + (aw2*ae2);
        ae3 = (aw1*ae2) + (aw2*ae3);
        ae4 = (aw1*ae3) + (aw2*ae4);
        ae5 = (aw1*ae4) + (aw2*ae5);
        ae6 = (aw1*ae5) + (aw2*ae6);

        MapBuffer1[i]=((((ac1*ae6) + ac2*ae5) + ac3*ae4) + ac4*ae3)*1000;
    }
//----
   return(0);
  }
//+------------------------------------------------------------------+
Comments