T3_v1
Download script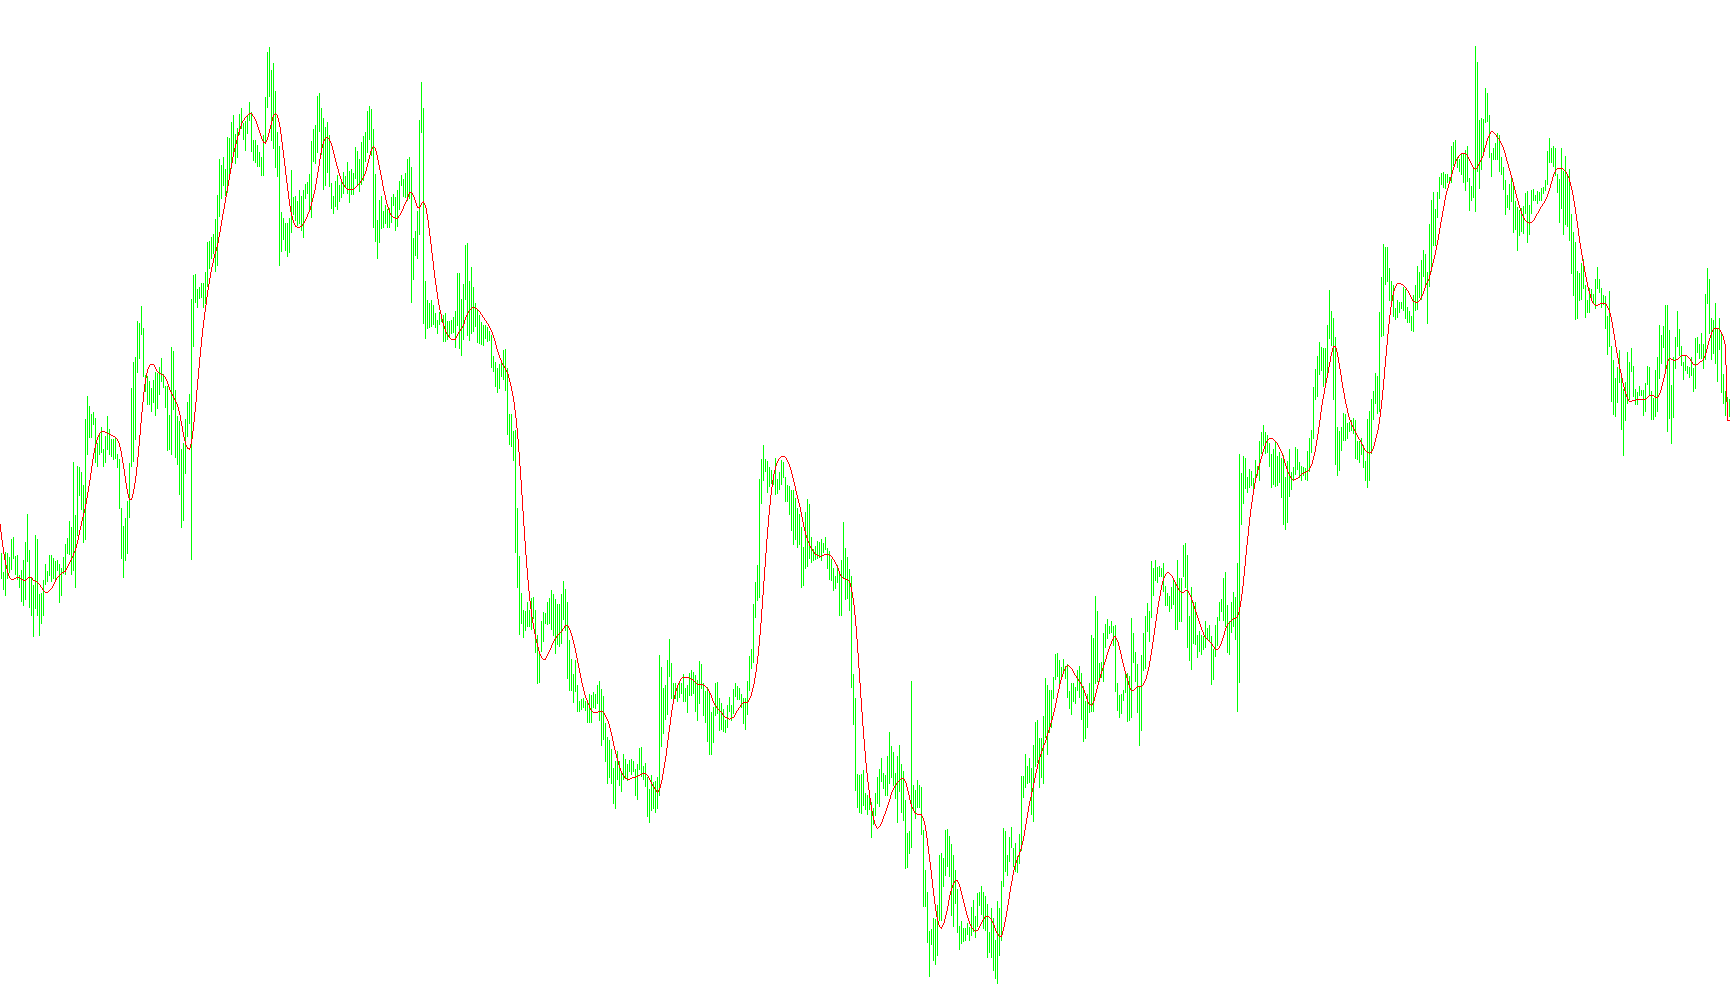
This script is a technical analysis tool designed for the MetaTrader platform to help traders visualize price trends more smoothly. Its primary function is to calculate and display a specialized type of Moving Average on your trading chart.
Core Functionality
Unlike a standard moving average that might react abruptly to every small price fluctuation, this indicator uses a multi-layered smoothing technique. It processes historical price data through several consecutive stages to filter out "market noise," resulting in a cleaner, more refined trend line.
How the Logic Works
The script follows a systematic three-step process to generate the final visual output:
1. Initialization and Weighting When you first apply the indicator, it establishes a set of mathematical weights based on two user-defined inputs: the time period (how far back the average looks) and a smoothing factor (which determines how aggressively the line reacts to new data). It converts these inputs into specific coefficients used for all subsequent calculations.
2. Sequential Smoothing (The "Chain" Effect) The heart of the script is a sequential calculation process. Instead of calculating one average, the logic passes the price through a chain of six different smoothing steps. Each step takes the result of the previous one and applies a weighted calculation to it. This "layering" effect ensures that the final line is significantly more stable than a simple moving average.
3. Final Mapping After the price data has been processed through all six stages, the script performs a final calculation to combine these values into a single output point. This result is then plotted on your chart as a solid red line.
Summary for the Trader
The goal of this logic is reducion of volatility. By running the price data through multiple layers of mathematical smoothing, the indicator aims to show you the underlying direction of the market while ignoring the minor "zigzag" movements that can often mislead traders. It provides a clearer picture of the long-term trend based on your specific period and smoothing preferences.
//+------------------------------------------------------------------+
//|                                                           T3.mq4 |
//|                                                           MojoFX |
//| http://groups.yahoo.com/group/MetaTrader_Experts_and_Indicators/ |
//+------------------------------------------------------------------+
#property copyright "MojoFX - Conversion only"
#property link      "http://groups.yahoo.com/group/MetaTrader_Experts_and_Indicators/"

#property indicator_chart_window
#property indicator_buffers 1
#property indicator_color1 Red

extern int MA_Period = 14;
extern double b = 0.7;

double MapBuffer[];

double e1,e2,e3,e4,e5,e6;
double c1,c2,c3,c4;
double n,w1,w2,b2,b3;

//+------------------------------------------------------------------+
//| Custom indicator initialization function                         |
//+------------------------------------------------------------------+
int init()
  {
//---- indicators setting
    SetIndexStyle(0,DRAW_LINE,STYLE_SOLID,1,Red);
    IndicatorDigits(MarketInfo(Symbol(),MODE_DIGITS));
    IndicatorShortName("Moving Average "+MA_Period);

    SetIndexBuffer(0,MapBuffer);

//---- variable reset
    e1=0; e2=0; e3=0; e4=0; e5=0; e6=0;
    c1=0; c2=0; c3=0; c4=0;
    n=0;
    w1=0; w2=0;
    b2=0; b3=0;

    b2=b*b;
    b3=b2*b;
    c1=-b3;
    c2=(3*(b2+b3));
    c3=-3*(2*b2+b+b3);
    c4=(1+3*b+b3+3*b2);
    n=MA_Period;

    if (n<1) n=1;
    n = 1 + 0.5*(n-1);
    w1 = 2 / (n + 1);
    w2 = 1 - w1;

//----
    return(0);
  }

//+------------------------------------------------------------------+
//| Custom indicator iteration function                              |
//+------------------------------------------------------------------+
int start()
  {
   int limit;
   int counted_bars=IndicatorCounted();
   if (counted_bars<0) return (-1);
   if (counted_bars>0) counted_bars--;
   limit=Bars-counted_bars;

//---- indicator calculation

    for(int i=limit; i>=0; i--)
    {
        e1 = w1*Close[i] + w2*e1;
        e2 = w1*e1 + w2*e2;
        e3 = w1*e2 + w2*e3;
        e4 = w1*e3 + w2*e4;
        e5 = w1*e4 + w2*e5;
        e6 = w1*e5 + w2*e6;

        MapBuffer[i]=c1*e6 + c2*e5 + c3*e4 + c4*e3;
    }
//----
   return(0);
  }
//+------------------------------------------------------------------+
Comments