T3_MA
Download script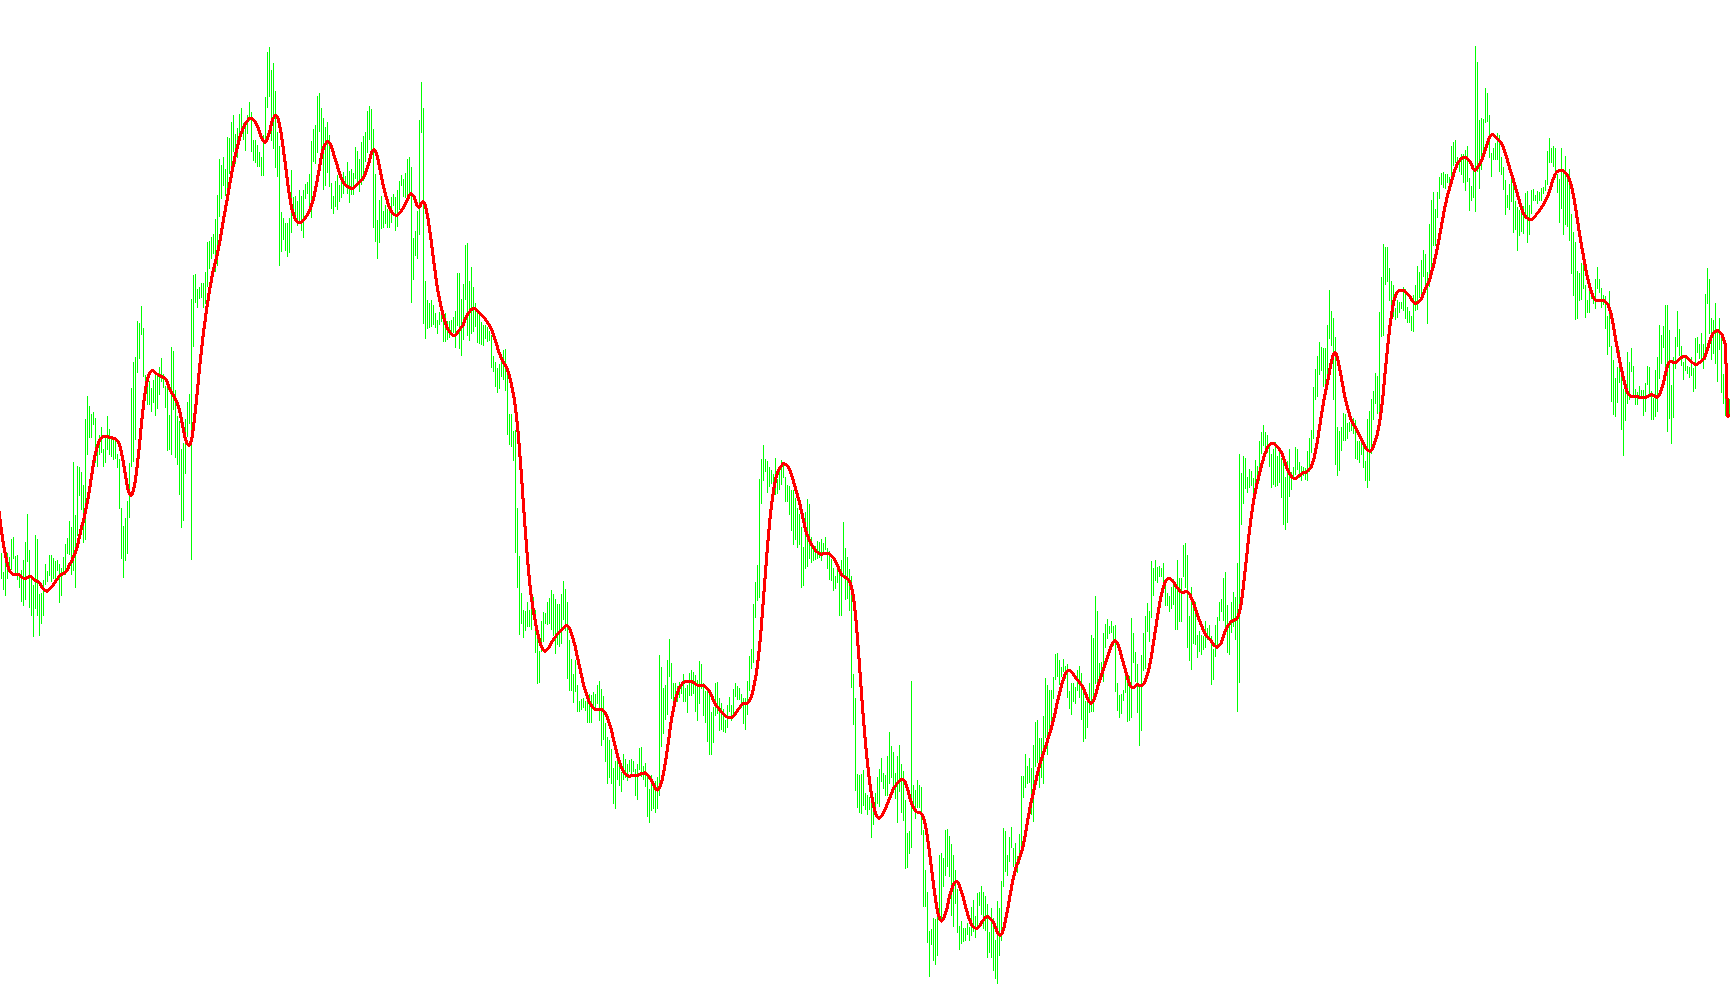
This script is a custom technical analysis tool designed for the MetaTrader platform. It generates a specific type of moving average, known as a T3 Moving Average, which is used by traders to identify trends in financial markets.
Core Purpose
The primary goal of this indicator is to smooth out price fluctuations (market "noise") while maintaining high sensitivity to actual price movements. Unlike standard moving averages that can sometimes lag behind the current market price, the T3 logic is engineered to provide a more responsive and accurate trend line.
How the Logic Works
1. User-Defined Parameters The tool relies on two main inputs that allow you to customize its behavior:
- Period: This determines the look-back window. A higher period results in a smoother, slower line; a lower period makes the line react more quickly to recent price changes.
- Factor (b): This is a constant used to weigh the calculations. It helps define how "aggressively" the indicator reacts to price shifts.
2. The Calculation Process The script processes market data through a sophisticated multi-stage filtering system:
- Weighting: It first assigns specific weights to the closing prices of the candles based on the period you selected.
- Layered Smoothing: Instead of calculating a simple average, the logic passes the price through a series of six internal "echo" calculations (represented as layers). Each layer acts as a filter, progressively refining the data.
- Final Output: After the data has been processed through these layers, the script applies a final mathematical formula to produce the resulting line on your chart.
Visual Representation
When applied to a trading chart, this logic creates a solid red line. This line represents the "smoothed" path of the market price. Traders typically use this to:
- Identify Trend Direction: If the price is consistently above the line, it may indicate an uptrend; below the line may suggest a downtrend.
- Spot Momentum: The curvature and slope of the line help traders see how strongly the market is moving in a particular direction.
In summary, this script transforms raw, jagged price data into a refined trend line, helping traders make clearer decisions by filtering out minor price fluctuations while staying closely aligned with the overall market movement.
//+------------------------------------------------------------------+
//|                                                           T3.mq4 |
//|                                                           MojoFX |
//| http://groups.yahoo.com/group/MetaTrader_Experts_and_Indicators/ |
//+------------------------------------------------------------------+
#property copyright "MojoFX - Conversion only"
#property link      "http://groups.yahoo.com/group/MetaTrader_Experts_and_Indicators/"

#property indicator_chart_window
#property indicator_buffers 1
#property indicator_color1 Red

extern int T3_Period = 14;
extern double b = 0.618;

double t3Array[];

double e1,e2,e3,e4,e5,e6;
double c1,c2,c3,c4;
double n,w1,w2,b2,b3;

//+------------------------------------------------------------------+
//| Custom indicator initialization function                         |
//+------------------------------------------------------------------+
int init()
  {
//---- indicators setting
    SetIndexStyle(0,DRAW_LINE,STYLE_SOLID,3,Red);
    SetIndexStyle(1,DRAW_LINE,STYLE_SOLID,1,White);

    IndicatorDigits(MarketInfo(Symbol(),MODE_DIGITS));
    IndicatorShortName("Moving Average "+T3_Period);

    SetIndexBuffer(0,t3Array);
    SetIndexLabel(0,"T3 "+T3_Period);


//---- variable reset

    e1=0; e2=0; e3=0; e4=0; e5=0; e6=0;
    c1=0; c2=0; c3=0; c4=0;
    n=0;
    w1=0; w2=0;
    b2=0; b3=0;

    b2=b*b;
    b3=b2*b;
    c1=-b3;
    c2=(3*(b2+b3));
    c3=-3*(2*b2+b+b3);
    c4=(1+3*b+b3+3*b2);
    n=T3_Period;

    if (n<1) n=1;
    n = 1 + 0.5*(n-1);
    w1 = 2 / (n + 1);
    w2 = 1 - w1;

//----
    return(0);
  }

//+------------------------------------------------------------------+
//| Custom indicator iteration function                              |
//+------------------------------------------------------------------+
int start()
  {
   int limit;
   int counted_bars=IndicatorCounted();
//---- check for possible errors
   if(counted_bars<0) return(-1);
//---- last counted bar will be recounted
   if(counted_bars>0) counted_bars--;
   limit=Bars-counted_bars;

//---- indicator calculation

    for(int i=limit; i>=0; i--)
    {
        e1 = w1*Close[i] + w2*e1;
        e2 = w1*e1 + w2*e2;
        e3 = w1*e2 + w2*e3;
        e4 = w1*e3 + w2*e4;
        e5 = w1*e4 + w2*e5;
        e6 = w1*e5 + w2*e6;

        t3Array[i]=c1*e6 + c2*e5 + c3*e4 + c4*e3;
    }
//----
   return(0);
  }
//+------------------------------------------------------------------+
Comments