T3_v2
Download script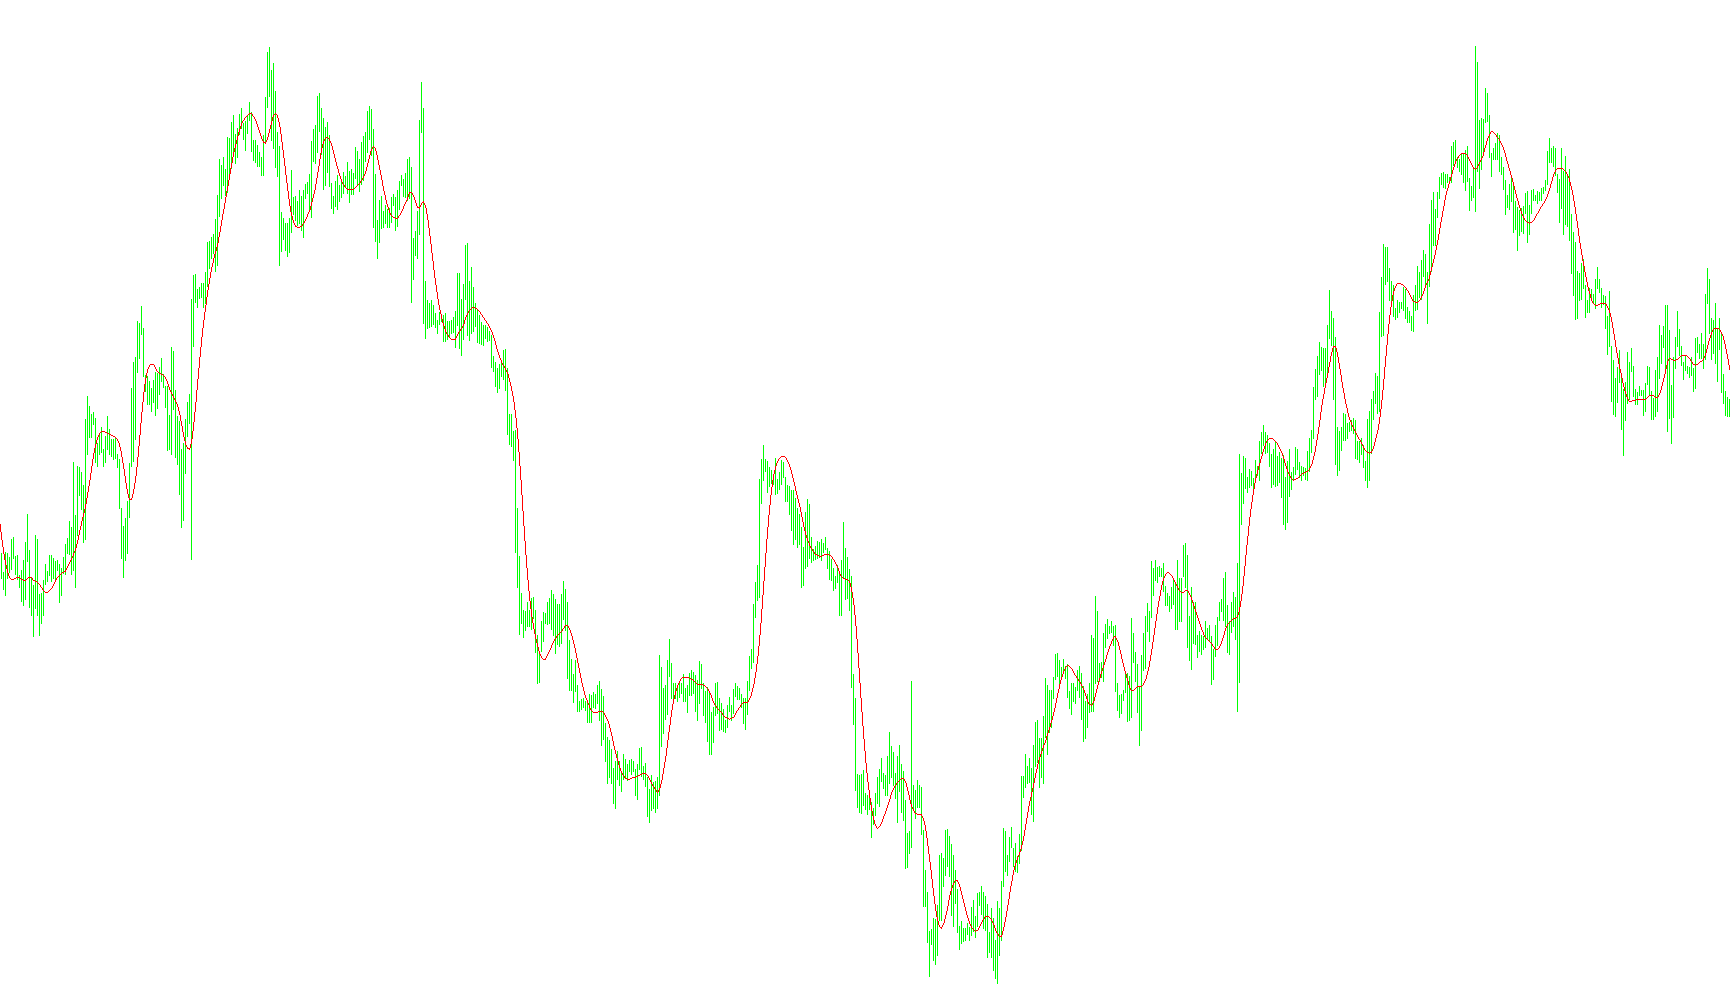
The T3 indicator is a sophisticated technical analysis tool designed to provide traders with a smooth, responsive view of price action. Unlike standard moving averages that can often be lagging or jagged, the T3 logic utilizes a specialized mathematical smoothing technique to filter out "market noise" while maintaining high sensitivity to actual trend changes.
Core Methodology
The primary objective of this script is to produce a refined trend line on your chart. It achieves this through a multi-layered smoothing process. Instead of calculating the average price once, the logic passes the price data through a series of sequential calculations. Each step takes the result of the previous calculation and blends it with the current price, creating a "compounding" effect.
Key Components of the Logic:
- Recursive Smoothing: The script employs a recursive method where each new value is dependent on its predecessors. By layering this calculation multiple times (specifically six levels deep in this script), it effectively "irons out" minor price fluctuations. This results in a curve that is significantly smoother than traditional moving averages.
- The Weighting Factor: The indicator uses a specific coefficient (referred to as 'b') to determine the balance between responsiveness and smoothness. By adjusting the period, the script calculates specific weights that dictate how much importance is given to the most recent price data versus the historical smoothed data.
- Polynomial Alignment: The final output of the indicator is derived from a polynomial calculation involving these multiple smoothing layers. This ensures that the resulting line represents a balanced "path" of the price, helping traders identify the primary direction of the market without being distracted by insignificant price spikes.
Practical Application
For the user, this logic translates into a cleaner visual experience on the trading chart. Because the T3 is designed to be both smooth and fast, it helps in:
- Trend Identification: Clearly visualizing whether the current market momentum is upward, downward, or sideways.
- Noise Reduction: Filtering out the "jitter" of short-term price movements that might otherwise trigger false signals.
- Support and Resistance: Providing a stable reference point to observe where price may react or pivot during a trading session.
//+------------------------------------------------------------------+
//| T3.mq4 |
//| MojoFX |
//| http://groups.yahoo.com/group/MetaTrader_Experts_and_Indicators/ |
//+------------------------------------------------------------------+
#property copyright "MojoFX - Conversion only"
#property link "http://groups.yahoo.com/group/MetaTrader_Experts_and_Indicators/"

#property indicator_chart_window
#property indicator_buffers 1
#property indicator_color1 Red

extern int MA_Period = 14;
extern double b = 0.7;


double MapBuffer[];

double e1[],e2[],e3[],e4[],e5[],e6[];
double c1,c2,c3,c4;
double n,w1,w2,b2,b3;

//+------------------------------------------------------------------+
//| Custom indicator initialization function |
//+------------------------------------------------------------------+
int init()
{
//---- indicators setting
SetIndexStyle(0,DRAW_LINE,STYLE_SOLID,1,Red);
IndicatorDigits(MarketInfo(Symbol(),MODE_DIGITS));
IndicatorShortName("T3"+MA_Period);
SetIndexDrawBegin(0,100);
SetIndexBuffer(0,MapBuffer);


//---- variable reset
//e2=0; e3=0; e4=0; e5=0; e6=0;
c1=0; c2=0; c3=0; c4=0;
n=0;
w1=0; w2=0;
b2=0; b3=0;

b2=b*b;
b3=b2*b;
c1=-b3;
c2=(3*(b2+b3));
c3=-3*(2*b2+b+b3);
c4=(1+3*b+b3+3*b2);
n=MA_Period;

if (n<1) n=1;
n = 1 + 0.5*(n-1);
w1 = 2 / (n + 1);
w2 = 1 - w1;

//----
return(0);
}

//+------------------------------------------------------------------+
//| Custom indicator iteration function |
//+------------------------------------------------------------------+
int start()
{
int limit;
int counted_bars=IndicatorCounted();
if (counted_bars<0) return (-1);
if (counted_bars>0) counted_bars--;
limit=(Bars-counted_bars)-1;

//---- indicator calculation
ArrayResize(e1, Bars+1);
ArrayResize(e2, Bars+1);
ArrayResize(e3, Bars+1);
ArrayResize(e4, Bars+1);
ArrayResize(e5, Bars+1);
ArrayResize(e6, Bars+1);

for(int i=limit; i>=0; i--)
{
e1[Bars-i] = w1*Close[i] + w2*e1[(Bars-i)-1];
e2[Bars-i] = w1*e1[Bars-i] + w2*e2[(Bars-i)-1];
e3[Bars-i] = w1*e2[Bars-i] + w2*e3[(Bars-i)-1];
e4[Bars-i] = w1*e3[Bars-i] + w2*e4[(Bars-i)-1];
e5[Bars-i] = w1*e4[Bars-i] + w2*e5[(Bars-i)-1];
e6[Bars-i] = w1*e5[Bars-i] + w2*e6[(Bars-i)-1];
//Print ("I- ",i, "Bars-I ",Bars-i);
MapBuffer[i]=c1*e6[Bars-i] + c2*e5[Bars-i] + c3*e4[Bars-i] + c4*e3[Bars-i];
}
//----
return(0);
}
//+------------------------------------------------------------------+
Comments