to_ind_Acceleration_Bands
Download script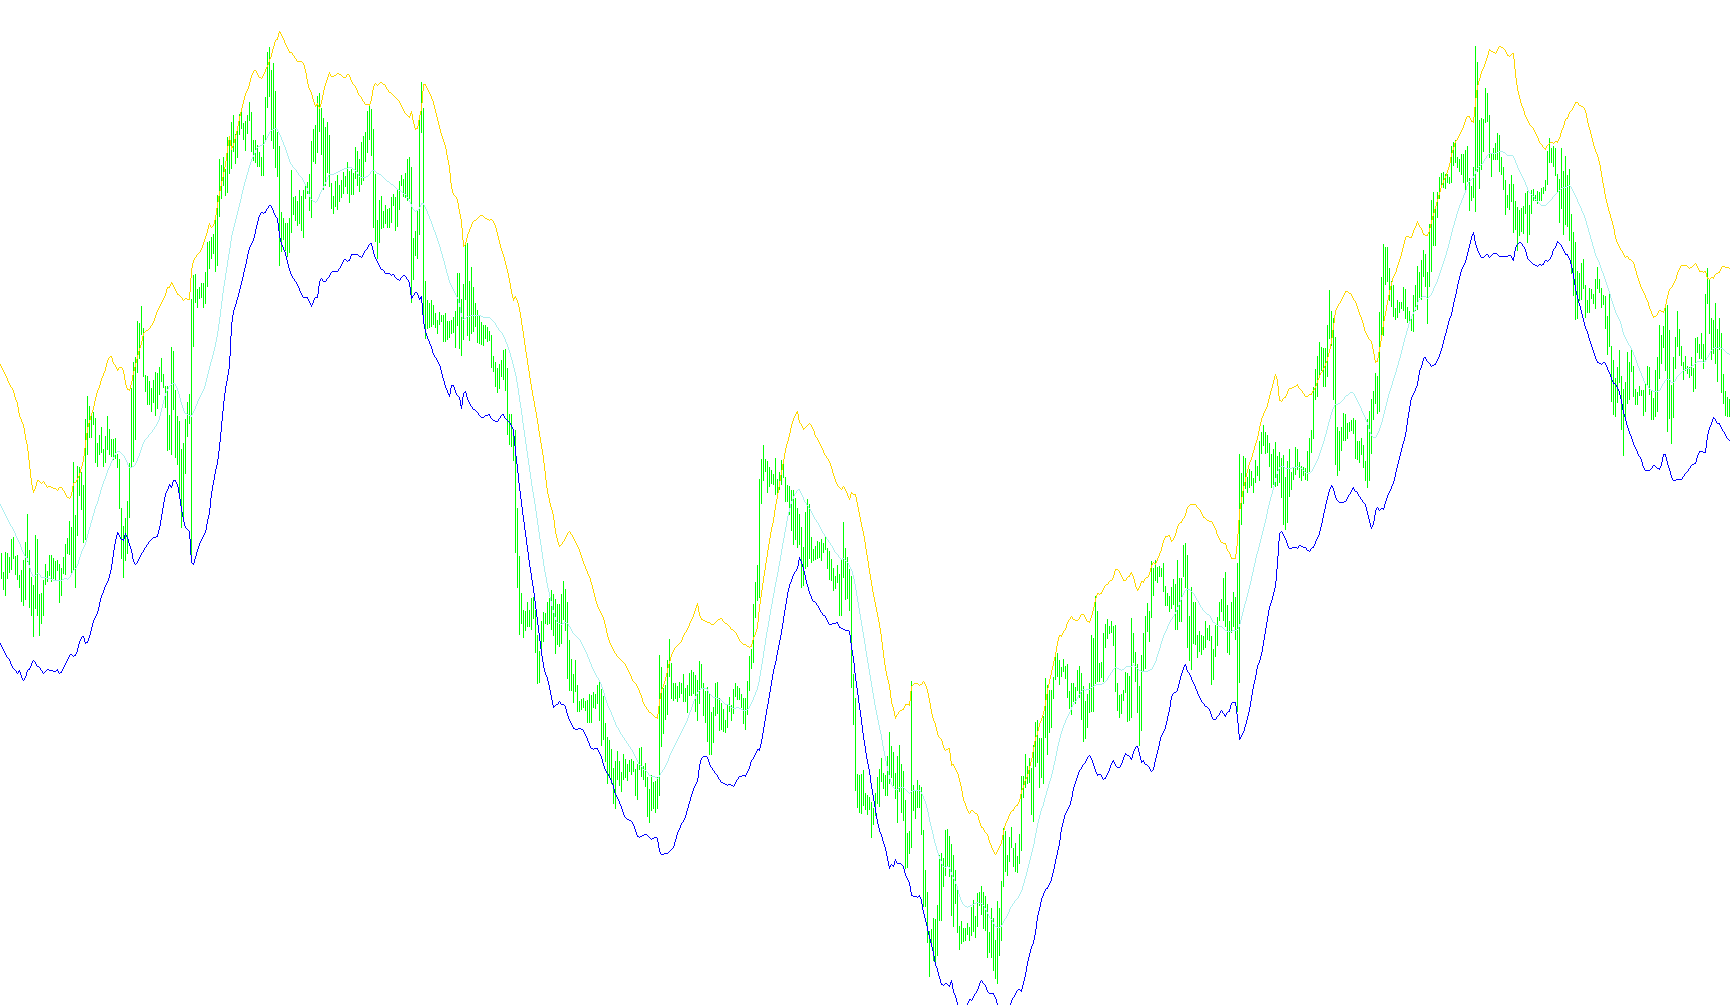
This tool is designed to visualize price dynamics on a trading chart by calculating and displaying dynamic "Acceleration Bands." Rather than simply following the current price, the script analyzes the relationship between the highest and lowest points of a candle to determine how aggressively the market is moving.
How the Logic Works
The indicator operates through a multi-stage calculation process to generate three distinct visual lines on your chart:
1. Volatility and Momentum Analysis The script first looks at each individual candle to measure its range (the distance between the high and low). It then calculates the "acceleration" of that price movement relative to the candle's midpoint. By applying a specific multiplier (the Factor), the tool identifies whether the price is pushing upward or downward with significant strength.
2. Creating the Dynamic Boundaries Based on that acceleration data, the script generates two primary boundary values:
- Upper Band: An adjusted price level that projects where the price might reach based on its current upward momentum.
- Lower Band: An adjusted price level that projects a potential floor based on current downward pressure.
3. Smoothing and Centering To ensure the visual data is readable and not overly erratic, the script performs a secondary "smoothing" pass. It takes the raw Upper and Lower boundaries calculated in the previous step and applies a Moving Average calculation. This filters out minor market noise, resulting in cleaner, more reliable trend lines.
Finally, the tool produces three visible components:
- AB Upper: The smoothed upper boundary of the acceleration.
- AB Lower: The smoothed lower boundary of the acceleration.
- AB Central: A centerline that represents the average equilibrium between the upper and lower bands.
Purpose for the Trader
By observing these bands, you can visualize the "stretch" of the market. When the gap between the Upper and Lower bands widens significantly, it indicates high acceleration or volatility. The Central line serves as a primary reference point to identify the prevailing trend and equilibrium, helping you see where the price is gravitating relative to its recent momentum.
//+------------------------------------------------------------------+
//|                                    to_ind_Acceleration_Bands.mq4 |
//|                                                                * |
//|                                                                * |
//+------------------------------------------------------------------+
#property copyright "http://dmffx.com"
#property link      "http://dmffx.com"

#property indicator_chart_window
#property indicator_buffers 3
#property indicator_color1 Red
#property indicator_color2 Red
#property indicator_color3 Red
//---- input parameters
extern double    Factor=2;
extern int       smPeriod=20;
extern int       smMethod=0;
//---- buffers
double ExtMapBuffer1[];
double ExtMapBuffer2[];
double ExtMapBuffer3[];
double ExtMapBuffer4[];
double ExtMapBuffer5[];
double ExtMapBuffer6[];
//+------------------------------------------------------------------+
//| Custom indicator initialization function                         |
//+------------------------------------------------------------------+
int init()
  {
//---- indicators
   IndicatorBuffers(6);
   SetIndexStyle(0,DRAW_LINE);
   SetIndexBuffer(0,ExtMapBuffer1);
   SetIndexStyle(1,DRAW_LINE);
   SetIndexBuffer(1,ExtMapBuffer2);
   SetIndexStyle(2,DRAW_LINE);
   SetIndexBuffer(2,ExtMapBuffer6);

   SetIndexBuffer(3,ExtMapBuffer3);
   SetIndexBuffer(4,ExtMapBuffer4);
   SetIndexBuffer(5,ExtMapBuffer5);

   SetIndexLabel(0,"AB Upper");
   SetIndexLabel(1,"AB Lower");
   SetIndexLabel(2,"AB Central");
//----
   return(0);
  }
//+------------------------------------------------------------------+
//| Custom indicator deinitialization function                       |
//+------------------------------------------------------------------+
int deinit()
  {
//----

//----
   return(0);
  }
//+------------------------------------------------------------------+
//| Custom indicator iteration function                              |
//+------------------------------------------------------------------+
int start()
  {
   int    limit=Bars-IndicatorCounted();

   for(int i=limit-1;i>=0;i--){
      ExtMapBuffer3[i]=(High[i]*(1+Factor*((((High[i]-Low[i])/((High[i]+Low[i])/2))*1000)*0.001)));
      ExtMapBuffer4[i]=(Low[i]*(1-Factor*((((High[i]-Low[i])/((High[i]+Low[i])/2))*1000)*0.001)));
      ExtMapBuffer5[i]=(ExtMapBuffer3[i]+ExtMapBuffer4[i])/2;
   }

   for(i=limit-1;i>=0;i--){
      ExtMapBuffer1[i]=iMAOnArray(ExtMapBuffer3,0,smPeriod,0,smMethod,i);
      ExtMapBuffer2[i]=iMAOnArray(ExtMapBuffer4,0,smPeriod,0,smMethod,i);
      ExtMapBuffer6[i]=(ExtMapBuffer1[i]+ExtMapBuffer2[i])/2;
   }

   return(0);
  }
//+------------------------------------------------------------------+
Comments