TD_Carrie
Download script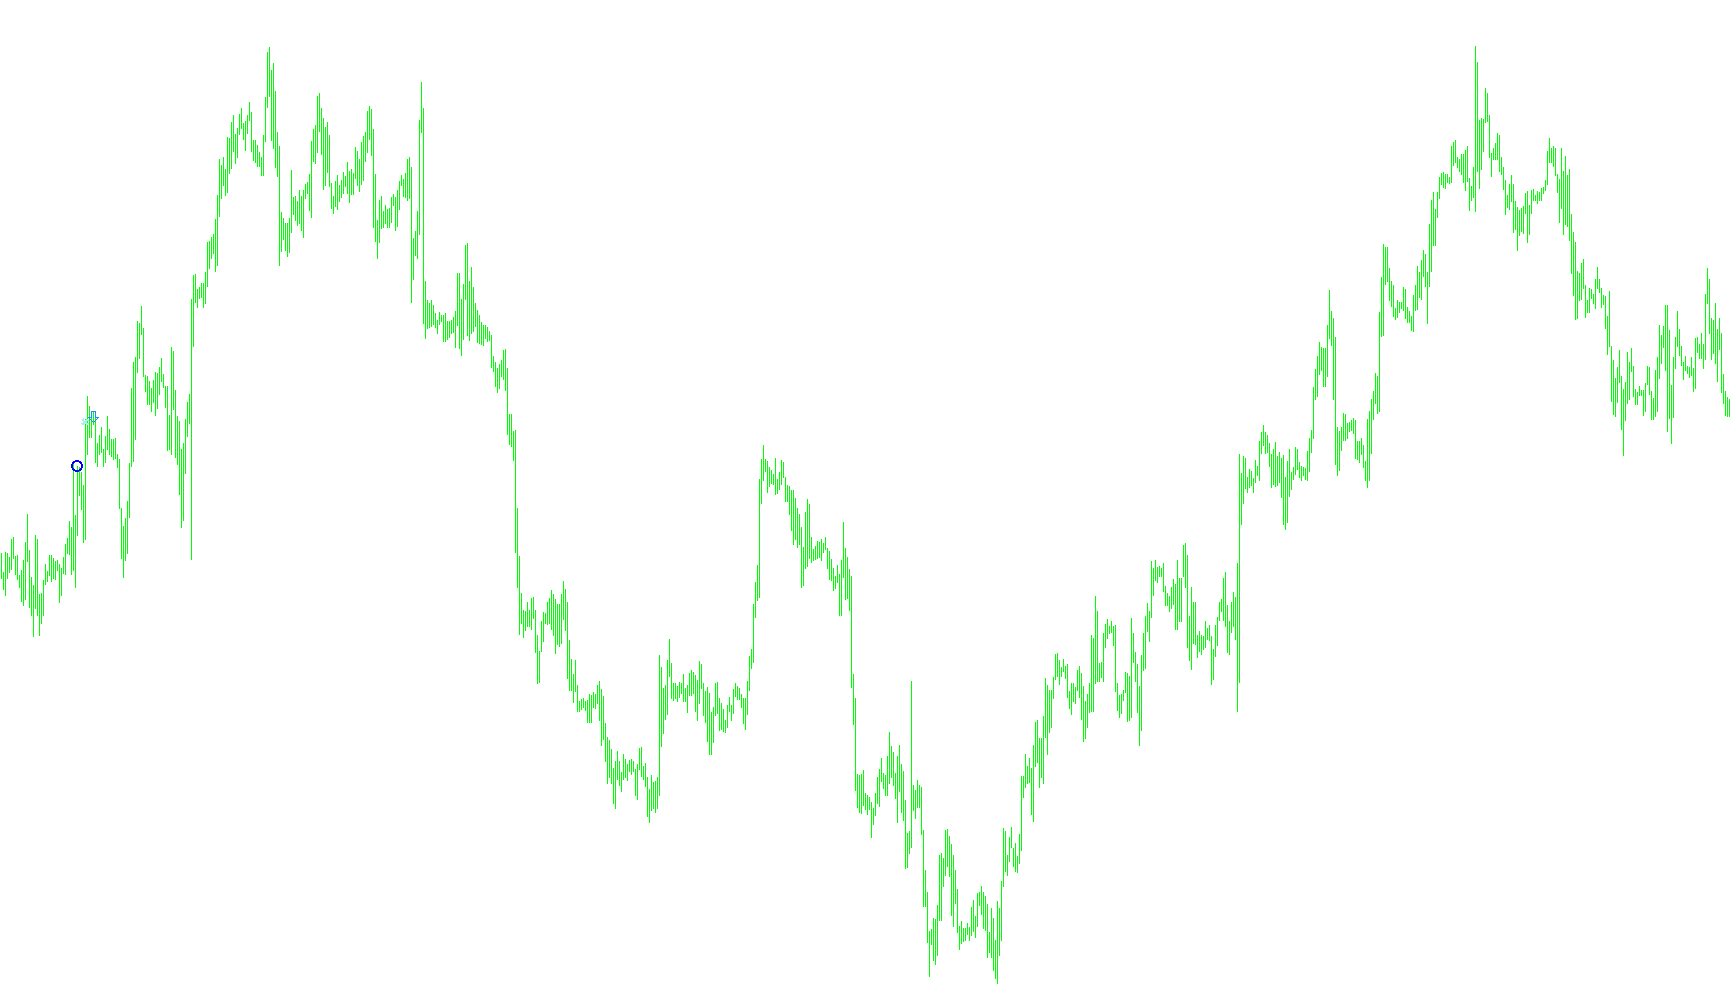
This script functions as a specialized technical analysis tool designed to identify and visualize specific price action patterns on a trading chart. Rather than relying on standard moving averages or volume oscillators, it focuses on the geometric relationship between consecutive candles to detect potential turning points in the market.
Core Logic and Behavior
The script scans historical price data by analyzing the high, low, open, and close prices of several candles simultaneously. It is looking for specific "peak" and "trough" formations that suggest a shift in momentum.
1. Identification of Peaks (Resistance): The logic looks for a specific sequence where a candle's high price is greater than the highs of the candles immediately preceding and following it. To confirm this is a significant structural point rather than just noise, the script cross-references this with the closing prices of nearby candles. When these conditions are met, the script identifies a "maximum value" point.
2. Identification of Troughs (Support): Similarly, the script monitors for "minimum value" points. It searches for a candle whose low price is lower than those around it, while also checking the relationship of the surrounding closing prices. This helps identify areas where the price has bottomed out and may be preparing for an upward move.
Visual Representation
When the script identifies these specific patterns, it reacts by plotting visual markers directly on your chart:
- Signal Arrows: The primary output of the script is the placement of arrows at the identified peak or trough locations. These serve as immediate visual cues for the trader.
- Price Boundaries: In addition to the primary signals, the script calculates specific price levels relative to the identified highs and lows (using multiplier constants). These are plotted as secondary markers to help define the "zone" of the price action.
- Dynamic Tracking: The script maintains an internal counter to manage how these markers appear over time, ensuring that the visual data remains organized and relevant to the current price movement.
Summary for the User
Essentially, this tool acts as an automated "pattern spotter." It combs through the price history to find specific structural shapes—peaks and valleys—and marks them with arrows. This allows a trader to quickly see where significant structural pivots have occurred without having to manually analyze every individual candle for trend reversals or support/resistance levels.
//+------------------------------------------------------------------+
//|                                                  TD_Carrie  |
//|                                               "Vyacheslav-Oleg"  |
//|                                                                  |
//+------------------------------------------------------------------+
#property copyright "Vyacheslav-Oleg"
#property link      "gendir@glagol.tvcom.ru"

//Èíäèêàòîð îòîáðàæàåòñÿ â òîì
#property indicator_chart_window

//#property indicator_separate_window
#property indicator_buffers 8
#property indicator_color1 Red
#property indicator_color2 Blue
#property indicator_color3 Navy
#property indicator_color4 Navy
#property indicator_color5 Navy
#property indicator_color6 Navy
#property indicator_color7 Navy
#property indicator_color8 Navy


//---- buffers
double Buf1[];
double Buf2[];
double Buf3[];
double Buf4[];
double Buf5[];
double Buf6[];
double Buf7[];
double Buf8[];


//Ñìåùåíèå ïî ëèíèè âðåìåíè è ìíîæèòåëü Point
int shift = 0, n =0;
//Ìèíèìàëüíîå è ìàêñèìàëüíîå çíà÷åíèå (âåùåñòâåííûå âåëè÷èíû)
double  maxvalue = 0, minvalue = 0;
double HH, LL;
int bar_counter;
bool counter = false;
//Èìÿ îáúåêòà òèïà "ñòðåëêà" ñ êîäîì code
int code=161;


//+------------------------------------------------------------------+
//| Custom indicator initialization function                         |
//+------------------------------------------------------------------+
int init()
  {
   string short_name;

//---- indicator line
   SetIndexStyle(0,DRAW_ARROW);
   SetIndexStyle(1,DRAW_ARROW);
   SetIndexStyle(2,DRAW_ARROW);
   SetIndexStyle(3,DRAW_ARROW);
   SetIndexStyle(4,DRAW_ARROW);
   SetIndexStyle(5,DRAW_ARROW);
   SetIndexStyle(6,DRAW_ARROW);
   SetIndexStyle(7,DRAW_ARROW);

   SetIndexArrow(0,161);//233
   SetIndexArrow(1,161);//234
   SetIndexArrow(2,"_");//234
   SetIndexArrow(3,242);//234
   SetIndexArrow(4,"_");//234
   SetIndexArrow(5,"_");//234
   SetIndexArrow(6,"_");//234
   SetIndexArrow(7,"_");//234

   SetIndexBuffer(0,Buf1);
   SetIndexBuffer(1,Buf2);
   SetIndexBuffer(2,Buf3);
   SetIndexBuffer(3,Buf4);
   SetIndexBuffer(4,Buf5);
   SetIndexBuffer(5,Buf6);
   SetIndexBuffer(6,Buf7);
   SetIndexBuffer(7,Buf8);

//---- name for DataWindow and indicator subwindow label
   short_name="My Ind";
   IndicatorShortName(short_name);

   SetIndexLabel(0,short_name);
   SetIndexLabel(1,short_name);

//----
   SetIndexDrawBegin(0,0);

//----
   return(0);
  }
//+------------------------------------------------------------------+
//| Custom indicator iteration function                              |
//+ ------------------------------------------------------------------+
int start()
  {
//Âû÷èñëåíèå ìèíèìóìà è ìàêñèìóìà
   for (shift = Bars; shift >= 0; shift--)
     {
     if (counter) bar_counter++;
     HH=(High[shift+5]*1.001);
     LL=(Low[shift+5]*0.999);
     minvalue=0;
     maxvalue=0;
         if  ((High[shift+5]>High[shift+6]) && (High[shift+5]>High[shift+4])     &&
              (High[shift+5]>High[shift+3]) && (Close[shift+2]<Close[shift+3]) &&
              (Open[shift+1]<High[shift+5] && High[shift+1]>HH))

              maxvalue=High[shift+5]+n*Point;

         if  ((Low[shift+5]<Low[shift+6]) && (Low[shift+5]<Low[shift+4])       &&
              (Low[shift+5]<Low[shift+3]) && (Close[shift+2]>Close[shift+3]) &&
              (Open[shift+1]>Low[shift+5] && Low[shift+1]<LL))

              minvalue=Low[shift+5]-n*Point;

   if (bar_counter == 4)
   {
      bar_counter = 0;
      counter = false;
      Buf4[shift] = High[shift]+2*Point;
   }

//Åñëè minvalue íå ðàâíî íóëþ, òî ðèñóåòñÿ çíàê.
   if(minvalue != 0)
   {
   Buf1[shift+5] =  minvalue;
   Buf5[shift+1] = LL*0.88;
   Buf6[shift+1] = LL*1.04;
   Buf3[shift+1] = LL;
   counter = true;
   bar_counter = 0;
   }
//Åñëè maxvalue íå ðàâíî íóëþ, òî ðèñóåòñÿ çíàê.
    if(maxvalue != 0)
    {
    Buf2[shift+5] = maxvalue;
    Buf7[shift+1] = HH*1.12;
    Buf8[shift+1] = HH*0.96;
    Buf3[shift+1] = HH;
    counter = true;
    bar_counter = 0;
    }
     }
//----

//----
   return(0);
  }
//+------------------------------------------------------------------+
Comments