test last 100
Download script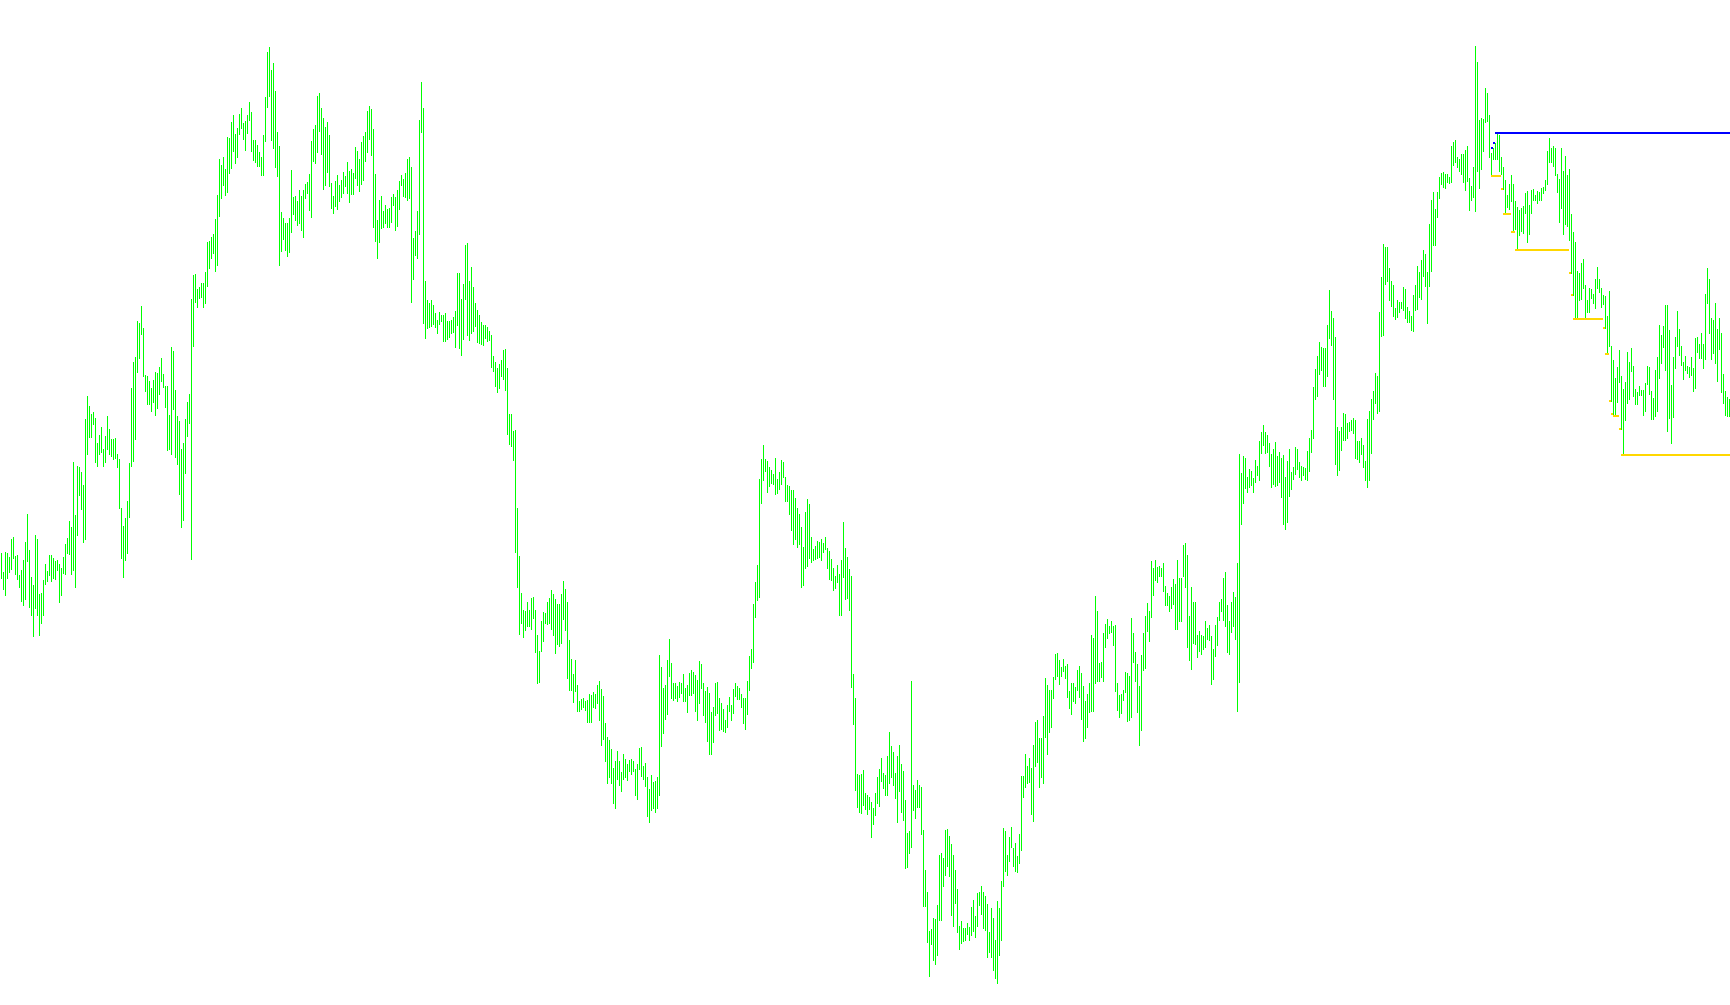
This tool is designed to provide a visual representation of price extremes over a specific historical period. Rather than following the current fluctuating price, it identifies and maps the highest peaks and lowest valleys within a defined window of time.
How the Logic Works
The script functions by scanning a fixed number of previous candles (the "lookback" period) to determine the boundaries of price action. It essentially calculates two distinct paths:
- The High Boundary: The logic identifies the highest price point reached during the lookback period and displays it as a consistent level.
- The Low Boundary: Simultaneously, it identifies the lowest price point reached during that same period and maps it as well.
Visual Representation
Instead of drawing continuous lines, the tool places specific markers on your chart to highlight these high and low boundaries. This allows you to see the "range" of recent price movement at a glance.
Key Characteristics
- Dynamic Range Mapping: As new candles form and old ones move out of the lookback period, the script automatically recalculates the highest and lowest points, ensuring the boundaries stay relevant to the most recent history.
- Automatic Scaling: The script includes built-in safety checks to ensure it functions correctly regardless of how much historical data is available on your chart. If the chart history is too short, it automatically adjusts its scope to remain functional.
- Visual Clarity: By highlighting these boundaries, the tool helps traders distinguish between current price noise and the significant extremes that have occurred over the recent timeframe.
Miscellaneous
11
Views
0
Downloads
0
Favorites
test last 100
//+------------------------------------------------------------------+
//|                                           MultiMovingAverage.mq4 |
//+------------------------------------------------------------------+
#property copyright "Ron T"
#property link      "http://www.lightpatch.com"

//in chart or out of chart
#property indicator_chart_window

// buffer allocation and color
#property indicator_buffers 2
#property indicator_color1 White
#property indicator_color2 Red

// actual line buffers
double ExtMapBuffer1[];
double ExtMapBuffer2[];


//+------------------------------------------------------------------+
//| Custom indicator init function                                   |
//|------------------------------------------------------------------|
int init()
   {
   SetIndexStyle(0,DRAW_ARROW);
   SetIndexBuffer(0, ExtMapBuffer1);
   SetIndexArrow(0,158);

   SetIndexStyle(1,DRAW_ARROW);
   SetIndexBuffer(1, ExtMapBuffer2);
   SetIndexArrow(1,158);

   return(0);
   }


//+------------------------------------------------------------------+
//| Custor indicator deinitialization function                       |
//+------------------------------------------------------------------+
int deinit()
   {
   return(0);
   }


//+------------------------------------------------------------------+
//| Custom indicator iteration function                              |
//+------------------------------------------------------------------+
int start()
   {
   double hitot=Low[120];     // yes, high=low - must start at lowest point
   double lotot=High[120];    // yes, low=high - must start at highest point

   int size=120;  // make this external one day
   int i;
   int pos=size;

   if ( Bars <= size*2 ) return(0);
   if ( size < 2 ) size = 10;
   if ( size > Bars ) size = 250;

// MAIN

   while(pos>=0)
      {
      if ( Low[pos]  < lotot ) lotot = Low[pos];
      if ( High[pos] > hitot ) hitot = High[pos];
      ExtMapBuffer1[pos]=lotot;
      ExtMapBuffer2[pos]=hitot;
 	   pos--;
      }

   // clean up old indicators in array
   for(i=size;i<size+10;i++) ExtMapBuffer1[i]=0;
   for(i=size;i<size+10;i++) ExtMapBuffer2[i]=0;


   return(0);
  }

//+------------------------------------------------------------------+
Comments