TG-Sinc-Spectrum-Cycle
Download script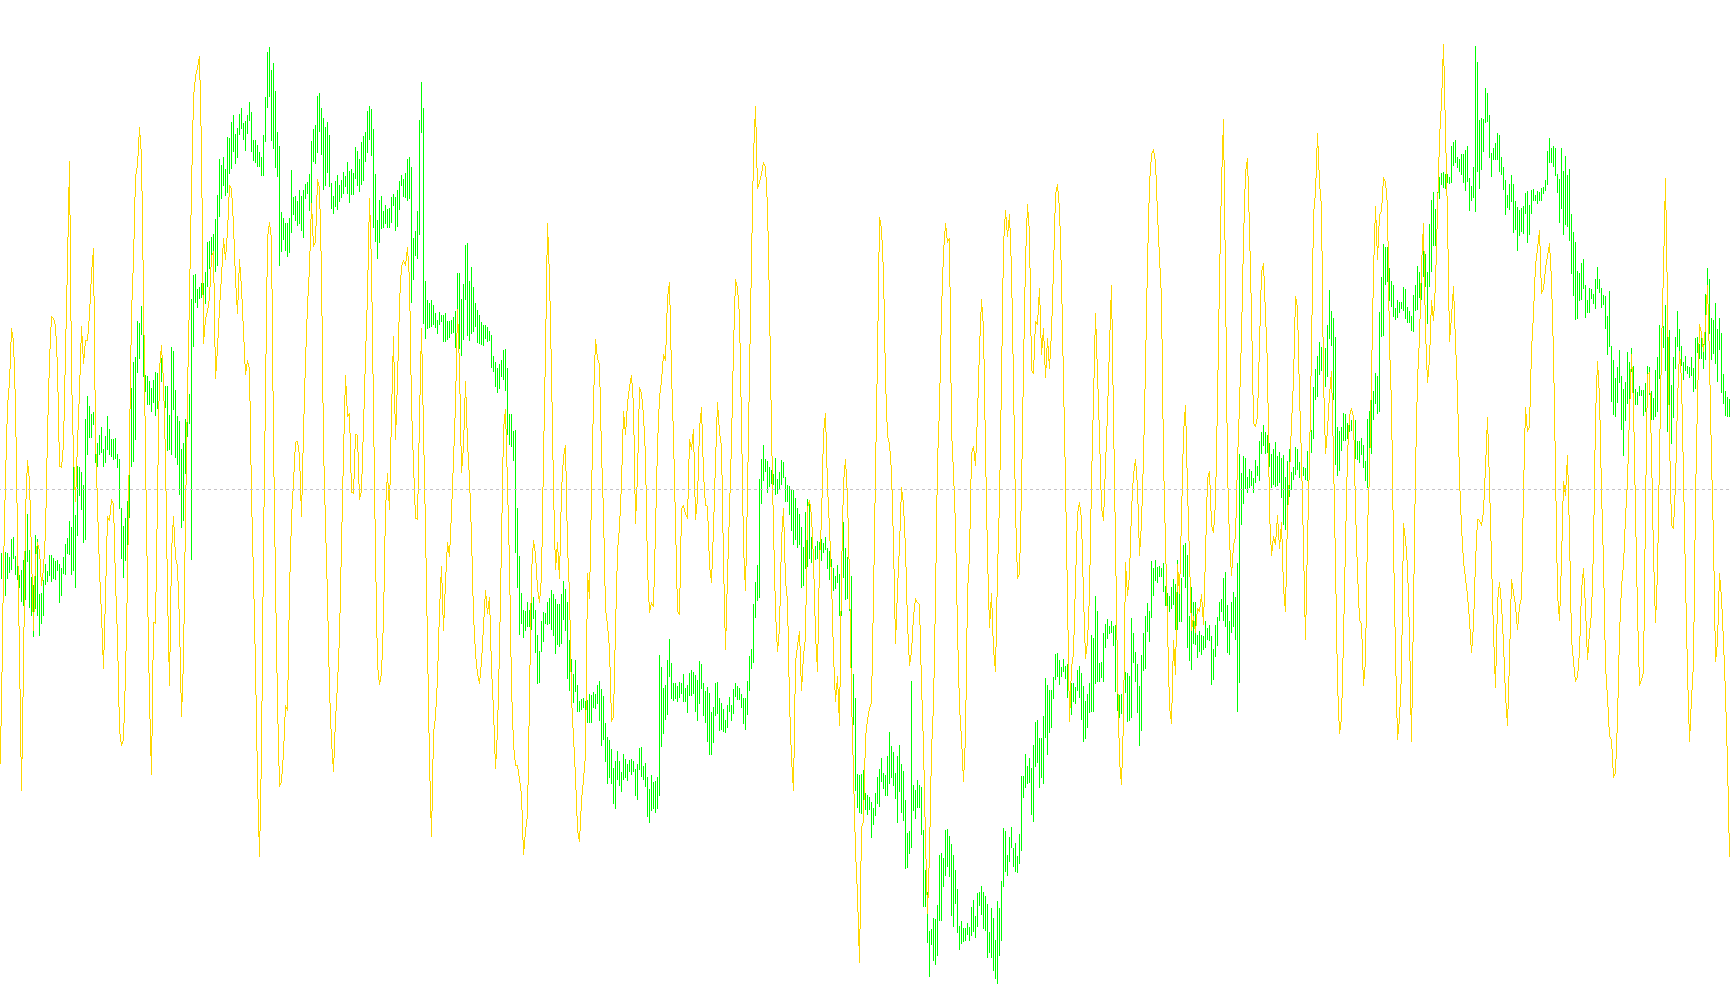
The Tudor Girl SINC Spectrum Cycle Analyser is a sophisticated technical analysis tool designed to interpret market momentum and cyclical patterns by applying advanced signal processing techniques to standard trading data. Instead of looking at raw price movements alone, this script aims to "filter" the noise of the market to reveal underlying trends and cycles.
Core Logic and Functionality
The tool operates through three primary conceptual stages:
1. Data Foundation (Stochastic Input) The foundation of the analysis is based on a Stochastic Oscillator. This represents the momentum of the market—essentially measuring where the current price sits relative to its recent historical range. By using this as a starting point, the tool focuses on whether the market is overbought, oversold, or trending in a specific direction.
2. Digital SINC Filtering The standout feature of this script is the "SINC Filter." In signal processing, a SINC filter is used to isolate specific frequencies while removing unwanted interference (noise).
- The script creates a mathematical "window" based on user-defined constraints (Length and Parameter K).
- It applies this window to the Stochastic data, effectively smoothing out erratic price jumps and highlighting more stable, recurring cycles.
- This allows the indicator to differentiate between temporary market "jitter" and actual, sustained directional momentum.
3. Normalization and Scaling To make the data readable and actionable for a trader, the script performs several transformations:
- Bias Adjustment: It calculates the deviation from a central baseline (the Bias).
- Logarithmic Scaling: The final output is processed using a logarithmic calculation. This compresses extreme movements while expanding smaller variations, providing a more balanced visual representation of market intensity.
- Optional Signal Cleaning: There is a built-in "Cleaner" toggle. When enabled, the tool suppresses minor fluctuations that fall below a certain threshold, ensuring that only significant movements are highlighted on your chart.
Summary for the User
In practical terms, this indicator acts like a high-tech lens. It takes standard momentum data, runs it through a specialized mathematical filter to strip away market noise, and scales the result into a visual "Spectrum." The goal is to provide a clearer picture of the market's cyclical behavior, helping you identify the strength and direction of a trend with greater precision than traditional oscillators alone.
/*
   Generated by EX4-TO-MQ4 decompiler V4.0.224.1 []
   Website: http://purebeam.biz
   E-mail : purebeam@gmail.com
*/
#property copyright "Copyright © 2009, Anne Boleyn, PhD"
#property link      "www.SimonShepherd.com"

#property indicator_separate_window
#property indicator_minimum -1.1
#property indicator_maximum 1.1
#property indicator_buffers 1
#property indicator_color1 Yellow

extern string x = "Tudor Girl SINC SPECTRUM CYCLE ANALYSER v1";
extern string x0 = "-------------- History (H) --------------";
extern int H = 5;
extern string x1 = "--------------- Bias (B) ----------------";
extern double B = 50.0;
extern string x2 = "------------ Signal Cleaner -------------";
extern bool Clean = FALSE;
extern string x3 = "---------- DIGITAL SINC FILTER ----------";
extern string x4 = "--------- Constraint Length (L) ---------";
extern int L = 5;
extern string x5 = "------------- Parameter (K) -------------";
extern double K = 2.0;
double g_ibuf_160[];
double gda_164[];
int g_index_168;
double gd_172;
double gd_180;
double gd_188 = 3.1415926535;
string gs_196;

int init() {
   IndicatorBuffers(1);
   SetIndexStyle(0, DRAW_LINE);
   SetIndexBuffer(0, g_ibuf_160);
   SetIndexEmptyValue(0, EMPTY_VALUE);
   SetIndexDrawBegin(0, L + 1);
   gs_196 = "TudorGirl\'s Sinc Spectrum Cycle (" + H + ", " + DoubleToStr(B, 1) + ", " + L + ", " + DoubleToStr(K, 1) + ")";
   IndicatorShortName(gs_196);
   SetLevelStyle(2, 1, Silver);
   SetLevelValue(1, 0.0);
   SetLevelValue(2, 0.99);
   SetLevelValue(3, -0.99);
   ArrayResize(gda_164, L);
   gd_180 = 1;
   gda_164[0] = 1.0;
   for (g_index_168 = 1; g_index_168 < L; g_index_168++) {
      gd_172 = K * g_index_168 / gd_188;
      gda_164[g_index_168] = MathSin(gd_172) / gd_172;
      gd_180 += gda_164[g_index_168];
   }
   for (g_index_168 = 0; g_index_168 < L; g_index_168++) gda_164[g_index_168] = gda_164[g_index_168] / gd_180;
   return (0);
}

int start() {
   int li_12;
   double ld_28;
   double ld_36;
   int l_ind_counted_8 = IndicatorCounted();
   int l_price_field_16 = 0;
   if (l_ind_counted_8 > 0) li_12 = Bars - l_ind_counted_8;
   if (l_ind_counted_8 < 0) return (0);
   if (l_ind_counted_8 == 0) li_12 = Bars - L - 1;
   for (int li_4 = li_12; li_4 >= 0; li_4--) {
      ld_36 = 0;
      for (int l_index_0 = 0; l_index_0 < L; l_index_0++) ld_36 += gda_164[l_index_0] * iStochastic(NULL, 0, H, 1, 1, MODE_SMA, l_price_field_16, MODE_MAIN, li_4 + l_index_0);
      ld_28 = (ld_36 - 50.0) / B;
      if (ld_28 > 0.9999) ld_28 = 0.9999;
      if (ld_28 < -0.9999) ld_28 = -0.9999;
      g_ibuf_160[li_4] = MathLog((ld_28 + 1.0) / (1 - ld_28)) / 10.0;
      if (MathAbs(g_ibuf_160[li_4]) < 0.9 && Clean) g_ibuf_160[li_4] = 0.0;
   }
   return (0);
}
Comments