TudorGirl_Vorticity_2
Download script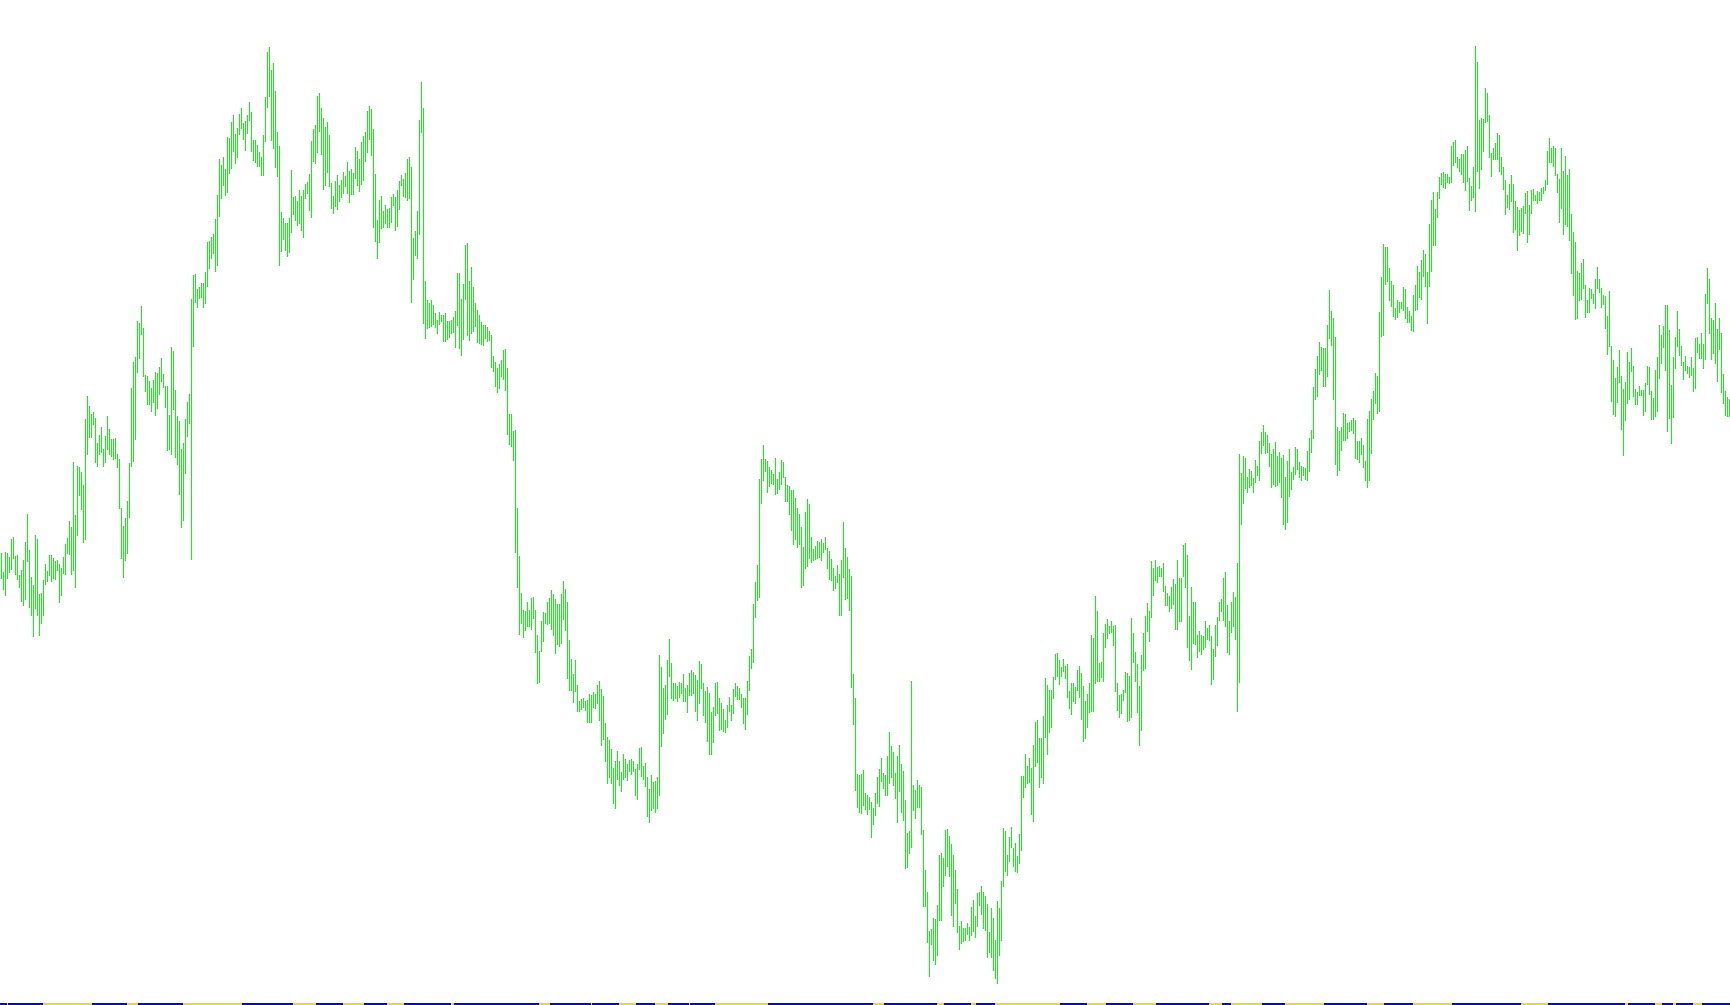
This tool, titled TudorGirl Hydrodynamic Vorticity 2.0a, is a specialized technical analysis indicator designed to help traders visualize price momentum and identify potential trend reversals on a financial chart. Rather than showing raw price data, it uses a mathematical model to calculate the "flow" of the market, represented by visual signals.
Core Logic and Methodology
The script operates through a multi-step mathematical process to interpret market movement:
1. Relative Positioning Analysis The indicator looks back at a specific window of recent price action (defined by a user-set parameter). It identifies the highest high and the lowest low within that period. By comparing the current price's midpoint to this historical range, the script determines where the price is currently "sitting" relative to its recent extremes.
2. Cumulative Momentum Calculation Unlike simple indicators that only look at a single moment in time, this script uses a recursive calculation. It takes the current price position, factors it against previous data points, and carries over a portion of the previous result. This creates a "weighted" history, allowing the indicator to smooth out minor market noise while maintaining the overall direction of the trend.
3. Logarithmic Scaling To translate these raw mathematical values into a usable visual format, the script applies a logarithmic transformation. This ensures that the movement is normalized, preventing extreme price spikes from distorting the visual representation and allowing for a more balanced view of market volatility.
Visual Output and Signals
The indicator produces two distinct visual cues on your chart to simplify decision-making:
- Trend Mapping: The primary logic generates a continuous value that moves between positive and negative boundaries. This represents the "vorticity" or the current strength and direction of the market flow.
- Directional Arrows: The script analyzes the transition between these values. When the momentum shifts from a negative state to a positive state (or vice versa), the indicator triggers visual markers:
- Upward Signals: These appear when the internal logic detects a shift toward bullish momentum.
- Downward Signals: These appear when the internal logic detects a shift toward bearish momentum.
Summary for the Trader
Essentially, this script acts as a filter. It ignores the "jitter" of the market to calculate a smoother underlying trend based on historical extremes and current positioning. By providing clear visual arrows at the moments where this calculated momentum flips, it aims to highlight potential entry or exit points where the market flow is changing direction.
#property copyright "Copyright © 2009, Anne"
#property link      "http://xxx"

#property indicator_separate_window
#property indicator_minimum 0.0
#property indicator_maximum 2.0
#property indicator_buffers 2
#property indicator_color1 Blue
#property indicator_color2 Red

extern int gi_76 = 8;
extern int WingDingUp = 110;
extern int WingDingDn = 110;
double g_ibuf_88[];
double g_ibuf_92[];
double g_ibuf_96[];

int init() {
   IndicatorBuffers(3);
   SetIndexBuffer(0, g_ibuf_92);
   SetIndexStyle(0, DRAW_ARROW, EMPTY);
   SetIndexArrow(0, WingDingUp);
   SetIndexBuffer(1, g_ibuf_96);
   SetIndexStyle(1, DRAW_ARROW, EMPTY);
   SetIndexArrow(1, WingDingDn);
   SetIndexBuffer(2, g_ibuf_88);
   IndicatorShortName("TudorGirl Hydrodynamic Vorticity 2.0a");
   return (0);
}

int start() {
   double ld_8;
   double ld_16;
   double ld_80;
   int li_4 = IndicatorCounted();
   double ld_32 = 0;
   double ld_40 = 0;
   double ld_unused_48 = 0;
   double ld_unused_56 = 0;
   double ld_64 = 0;
   double ld_unused_72 = 0;
   double l_low_88 = 0;
   double l_high_96 = 0;
   if (li_4 > 0) li_4--;
   int li_0 = Bars - li_4;
   for (int li_104 = 0; li_104 < Bars; li_104++) {
      l_high_96 = High[iHighest(NULL, 0, MODE_HIGH, gi_76, li_104)];
      l_low_88 = Low[iLowest(NULL, 0, MODE_LOW, gi_76, li_104)];
      ld_80 = (High[li_104] + Low[li_104]) / 2.0;
      if (l_high_96 - l_low_88 == 0.0) ld_32 = 0.67 * ld_40 + (-0.33);
      else ld_32 = 0.66 * ((ld_80 - l_low_88) / (l_high_96 - l_low_88) - 0.5) + 0.67 * ld_40;
      ld_32 = MathMin(MathMax(ld_32, -0.999), 0.999);
      if (1 - ld_32 == 0.0) g_ibuf_88[li_104] = ld_64 / 2.0 + 0.5;
      else g_ibuf_88[li_104] = MathLog((ld_32 + 1.0) / (1 - ld_32)) / 2.0 + ld_64 / 2.0;
      ld_40 = ld_32;
      ld_64 = g_ibuf_88[li_104];
   }
   bool li_108 = TRUE;
   for (li_104 = Bars; li_104 >= 0; li_104--) {
      ld_16 = g_ibuf_88[li_104];
      ld_8 = g_ibuf_88[li_104 + 1];
      if ((ld_16 < 0.0 && ld_8 > 0.0) || ld_16 < 0.0) li_108 = FALSE;
      if ((ld_16 > 0.0 && ld_8 < 0.0) || ld_16 > 0.0) li_108 = TRUE;
      if (!li_108) {
         g_ibuf_96[li_104] = 1.0;
         g_ibuf_92[li_104] = EMPTY_VALUE;
      } else {
         g_ibuf_92[li_104] = 1.0;
         g_ibuf_96[li_104] = EMPTY_VALUE;
      }
   }
   return (0);
}
Comments