Ticker Trail_v2
Download script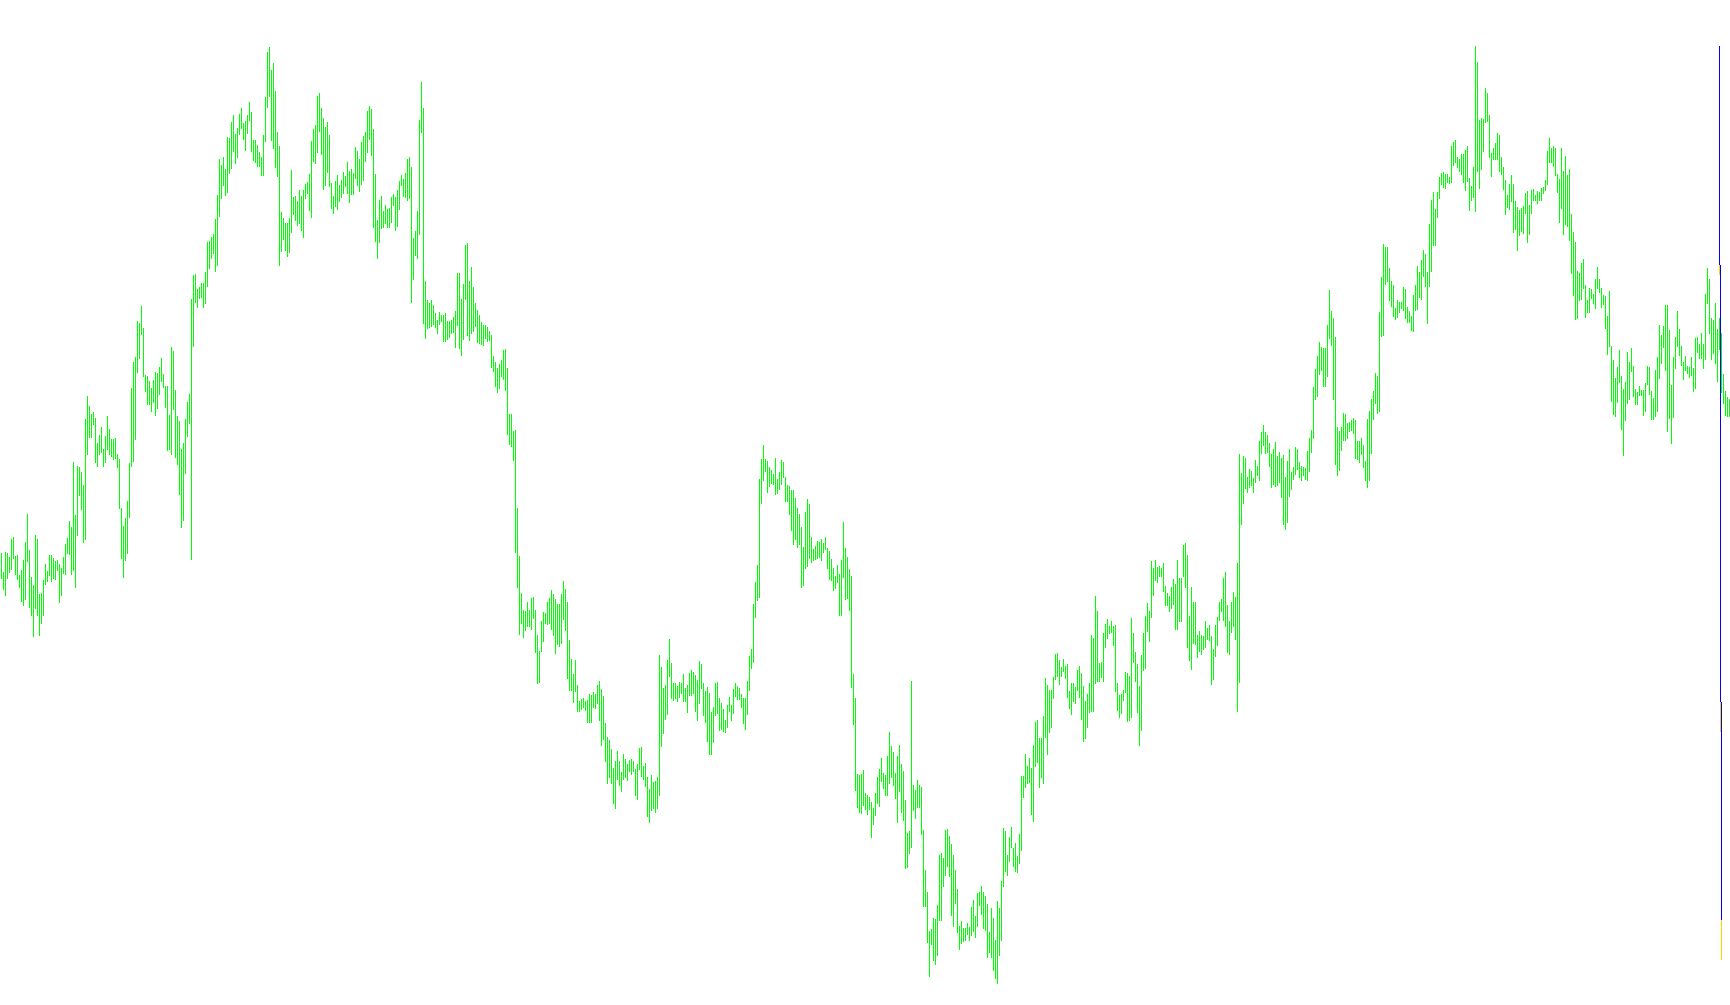
The Ticker Trail is a specialized visual tool designed to track price movements and provide a smoothed "trail" perspective of market activity. Instead of simply looking at the raw, fluctuating price, this script helps users visualize the price path relative to a specific set distance, making it easier to observe trends and significant movements over a historical period.
How It Works
1. Historical Price Recording The script continuously monitors the current market price. Every time the price changes, the tool captures that new value and stores it in a chronological list. It maintains a specific history of these data points (defined by the user), allowing the tool to "remember" where the price has been over a set number of bars.
2. The Trail Mechanism The core logic revolves around the "Trail" parameter. As the script processes each historical price point, it compares the current value against its neighbors within the specified range.
- If a price fluctuates wildly, the tool calculates a "smoothed" boundary.
- It essentially ensures that the visual line doesn't jump erratically; if a price drop or spike exceeds the allowed "trail" distance, the script pulls that value back to the nearest allowed boundary.
3. Visual Output The indicator provides two distinct visual components in a separate window:
- The Raw Ticker: This represents the actual sequence of historical prices as they occurred.
- The Trail Line: This is the processed data. It follows the general direction of the raw ticker but remains "tethered" to the trail distance, effectively filtering out minor noise and highlighting the underlying trend or momentum of the price action.
Key Features for the User
- Trend Clarity: By smoothing out micro-fluctuations, the tool allows you to see the broader path of the market more clearly.
- Customizable History: You can decide how many past bars the script should track, allowing for a broad historical view or a focused recent analysis.
- Adjustable Sensitivity: The "Trail" setting lets you define how much "leash" the price has. A smaller trail will follow the price more tightly, while a larger trail will create a smoother, broader trend line.
//+------------------------------------------------------------------+
//|                                                                  |
//|                 Ticker Trail.                                    |
//|                                                                  |
//+------------------------------------------------------------------+
#property copyright "mandorr@gmail.com"
//----
#property indicator_separate_window
#property indicator_buffers 2
#property indicator_color1 Gray
#property indicator_width1 1
#property indicator_style1 0
#property indicator_color2 Gray
#property indicator_width2 2
#property indicator_style2 0
//----
extern int Trail=10;         // Òðàë
extern int CountBars=1000;   // Êîëè÷åñòâî îòîáðàæàåìûõ áàðîâ
//----
int count;
int price;
int price_prev;
int trail;
double ticker[10];           // áóôåð òèêîâ
double buffer0[];
double buffer1[];
//+------------------------------------------------------------------+
//|                                                                  |
//+------------------------------------------------------------------+
void init()
  {
   SetIndexBuffer(0,buffer0);
   SetIndexLabel(0,"Value");
   SetIndexDrawBegin(0,0);
   SetIndexBuffer(1,buffer1);
   SetIndexLabel(1,"Trail");
   SetIndexDrawBegin(1,0);
   count=ArrayResize(ticker,CountBars);
   count=0;
   price_prev=0;
   trail=0; if (Trail>0) trail=Trail;
  }
//+------------------------------------------------------------------+
//|                                                                  |
//+------------------------------------------------------------------+
void start()
  {
   int i, value;
   price=MathRound(Bid/Point);
   if (price_prev==0)
     {
      count=0;
      price_prev=price;
      ticker[0]=price*Point;
      buffer0[0]=ticker[0];
      buffer1[0]=ticker[0];
      IndicatorShortName("Ticker ("+count+") Trail ("+trail+")");
      return;
     }
   if (price==price_prev) return;
   price_prev=price;
   for(i=count; i>=0; i--)
     {
      ticker[i+1]=ticker[i];
     }
   ticker[0]=price*Point;
   if (count<CountBars-1) count++;
   value=MathRound(ticker[count]/Point);
   for(i=count; i>=0; i--)
     {
      buffer0[i]=ticker[i];
      price=MathRound(ticker[i]/Point);
      if (value<price-trail) value=price-trail;
      if (value>price+trail) value=price+trail;
      buffer1[i]=value*Point;
     }
   IndicatorShortName("Ticker ("+count+") Trail ("+trail+")");
  }
//+------------------------------------------------------------------+
Comments