TP_ChannelWidth
Download script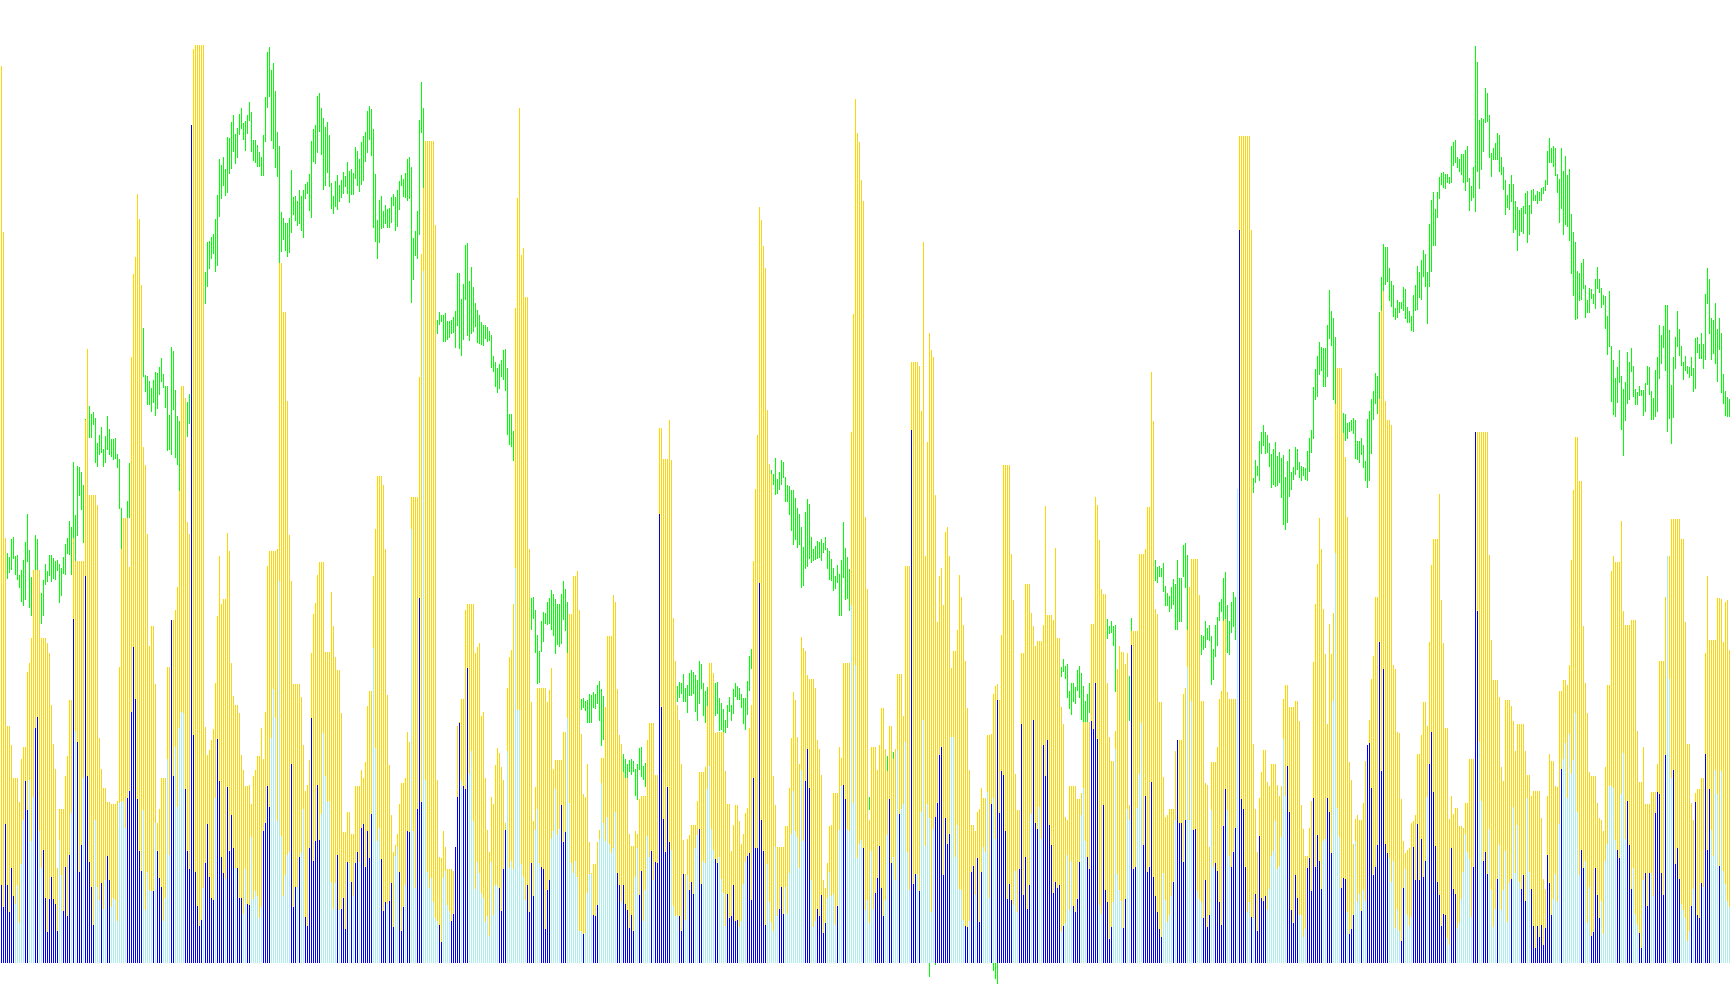
This tool is designed to provide traders with a visual representation of market volatility and price movement trends. It functions by analyzing historical price data to calculate specific measurements regarding the distance between high and low price points over set timeframes.
How the Logic Works
The script processes the market data through three primary calculations to help users understand the "width" or "range" of the current trading environment:
1. Price Range Measurement The core logic identifies the highest and lowest prices reached during a specific number of past candles (the period). By calculating the difference between these two extremes, the script determines the total "swing" of the market. This is then converted into a standardized format (pips) so that traders can easily see the magnitude of price movements.
2. Trend Direction and Strength The tool evaluates recent price action to determine which direction the market is leaning. It compares the current closing price against an average of previous prices.
- If the market shows signs of moving upward, it highlights a specific value representing the channel width.
- If the market shows signs of moving downward, it captures that movement in a different manner. This allows users to distinguish between bullish and bearish momentum based on how much "room" the price is covering in its current direction.
3. Visual Representation Instead of just providing numbers, the script translates these calculations into a separate visual window on your chart. It uses three distinct types of bars (histograms):
- The Primary Range: A prominent white histogram that tracks the overall volatility (the total distance from high to low) over the user-defined period.
- Directional Indicators: Smaller colored histograms (Green and Red) that signify whether the price movement is currently favoring the upside or the downside.
Summary for Traders
In simple terms, this script tells you how "busy" the market is and which way it wants to go. A larger histogram indicates high volatility—meaning prices are swinging widely. By looking at the color-coded bars, you can quickly identify if those swings are primarily occurring on the way up or the way down, helping you gauge the intensity of the current market trend.
//+------------------------------------------------------------------+
//|                                               TP_CcwnnelWidth.mq4 |
//|                                                      Ron Mauldin |
//|                                                  http://fx41.com |
//+------------------------------------------------------------------+
#property copyright "Ron Mauldin"
#property link      "http://fx41.com"

#property indicator_separate_window
#property indicator_buffers 3
#property indicator_color1 White
#property indicator_color2 Green
#property indicator_color3 Red
#property indicator_width1 3
#property indicator_width2 1
#property indicator_width3 1
#property  indicator_minimum 0.0

//----
extern int CW_Periods=7;
extern int CW_PipMultiplier=10000;
//---- buffers
double cwPeriodPips[];
double cwUP[];
double cwDN[];

int init(){
 SetIndexStyle(0,DRAW_HISTOGRAM);
 SetIndexBuffer(0, cwPeriodPips);
 SetIndexDrawBegin(0,10);
 SetIndexStyle(1,DRAW_HISTOGRAM);
 SetIndexBuffer(1, cwUP);
 SetIndexDrawBegin(1,10);
 SetIndexStyle(2,DRAW_HISTOGRAM);
 SetIndexBuffer(2, cwDN);
 SetIndexDrawBegin(2,10);
 return(0);
}
int deinit(){return(0);}
int start(){
 double cwOpen, cwHigh, cwLow, cwClose,cwPeriodMax,cwPeriodMin,cwChannelWidth;
 int counted_bars = IndicatorCounted();
 if(counted_bars<0) counted_bars=0;
 if(counted_bars>0) counted_bars--;
 int limit = (Bars - 1 - counted_bars);
 for(int bar = limit; bar >= 0; bar--){
  cwPeriodMax=0;
  cwPeriodMin=0;
  cwOpen=((((((Open[bar+3]+High[bar+3]+Low[bar+3]+Close[bar+3])/4)+((Open[bar+2]+High[bar+2]+Low[bar+2]+Close[bar+2])/4))/2)+((Open[bar+1]+High[bar+1]+Low[bar+1]+Close[bar+1])/4))/2);
  cwClose=(Open[bar]+High[bar]+Low[bar]+Close[bar])/4;
  cwHigh=High[bar];
  cwLow=Low[bar];
  cwChannelWidth=CW_PipMultiplier*(cwHigh-cwLow);
  if(cwOpen<cwClose){
   cwUP[bar]=cwChannelWidth;
   cwDN[bar]=0;
  }else{
   cwUP[bar]=0;
   cwDN[bar]=cwChannelWidth;
  }
  cwPeriodMax = High[Highest(NULL,0,MODE_HIGH,CW_Periods,bar)];
  cwPeriodMin = Low[Lowest(NULL,0,MODE_LOW,CW_Periods,bar)];
  cwPeriodPips[bar]=CW_PipMultiplier*(cwPeriodMax-cwPeriodMin);
 }
 return(0);
}
Comments