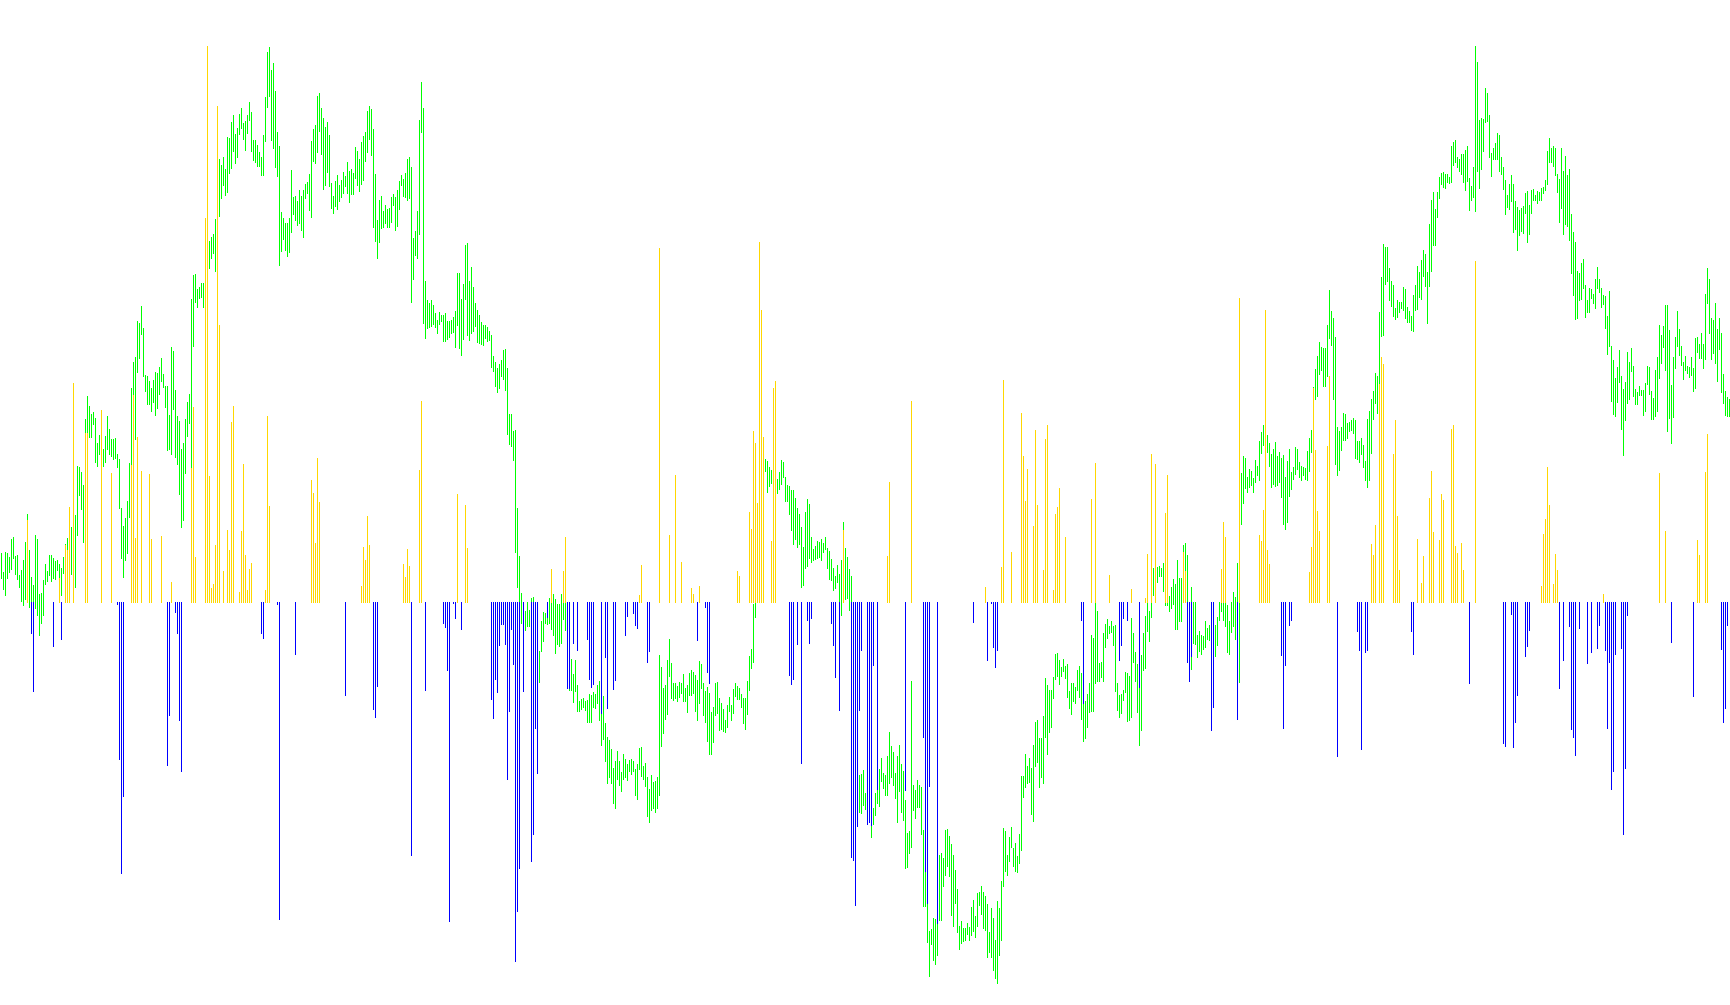
The Trend Manager is a technical analysis tool designed to provide traders with a visual representation of market momentum and trend direction. Unlike standard indicators that might clutter the main price chart, this script operates in a separate window at the bottom of your screen, providing a clear "histogram" view of whether the market is moving up, moving down, or remaining neutral.
Core Logic and Mechanics
The logic behind the Trend Manager relies on comparing two different timeframes (or "periods") simultaneously to determine the strength and consistency of price movement. Here is how it processes data:
1. Calculating Middle Prices The tool looks at specific windows of time—defined by your settings—and identifies the highest high and the lowest low within those periods. It then calculates the "Middle Price" (the midpoint between that high and low). By doing this for two different settings, the script can see what is happening in the short term versus the longer term.
2. Identifying Directional Movement The script calculates the difference between these Middle Prices across a small time offset. Essentially, it asks:
- Is the current short-term midpoint higher or lower than where it was a few bars ago?
- Is the current long-term midpoint higher or lower than where it was a few bars ago?
3. Trend Confirmation (The "Agreement" Rule) This is the most critical part of the logic. The tool looks for agreement between the short-term and long-term movements:
- Conflicting Trends: If the short-term trend is moving up while the long-term trend is moving down (or vice versa), the script considers the market to be in a state of uncertainty or transition. In this scenario, the histogram remains flat at zero.
- Consistent Trends: If both the short-term and long-term trends are moving in the same direction (both up or both down), the script confirms the trend.
4. Visual Output Once a consistent trend is confirmed, the tool calculates the magnitude of that movement:
- Upward Trend: If both are moving up consistently, a Blue histogram bar appears, showing the strength of the move.
- Downward Trend: If both are moving down consistently, a Red histogram bar appears.
Summary for the Trader
The primary goal of this logic is to filter out "noise." By requiring both the short-term and long-term price points to agree before displaying a bar, it helps traders avoid entering trades during choppy markets where the price is fluctuating without a clear direction. When you see a solid block of color in the histogram, it indicates that the market has established a unified direction across multiple time horizons.
/*-----------------------------+
|			       |
| Shared by www.Aptrafx.com    |
|			       |
+------------------------------*/

// Trend Manager Open2 separate window.mq4
//
// Look & Feel of original based on indicator sold at traderstradingsystem.com
// this one plots in lower histogram window.

// No representation it is identical.
// This file is licensed under the terms of the GNU General Public License V2.
//
// (c) 2006 Matt Kennel (mbkennel@gmail.com)

#property indicator_separate_window
#property indicator_buffers 2
#property indicator_color1 Red
#property indicator_color2 Blue


extern int TM_Period_1 = 7;
extern int TM_Shift_1 = 2;
extern int TM_Period_2 = 13; // Put TM_Period_2 params equal to first to get orig TrendManager system
extern int TM_Shift_2 = 1;

int Max_Period;
int Max_Shift;

double Up_Histogram[];
double Down_Histogram[];

int a_begin;

int init()
{
   Max_Shift = MathMax(TM_Shift_1,TM_Shift_2);
   Max_Period = MathMax(TM_Period_1,TM_Period_2);

   int b_begin = Max_Period+Max_Shift-1;

   SetIndexStyle(1,DRAW_HISTOGRAM,STYLE_SOLID);
   SetIndexBuffer(1,Down_Histogram);
   SetIndexDrawBegin(1,b_begin);
   SetIndexLabel(1,"TM_Period+");

   SetIndexStyle(0,DRAW_HISTOGRAM,STYLE_SOLID);
   SetIndexBuffer(0,Up_Histogram);
   SetIndexDrawBegin(0,b_begin);
   SetIndexLabel(0,"TM_Period");

   return(0);
}

int start()
{
   int    i,k;
   int    counted_bars=IndicatorCounted();
   double high,low,price;

   if(Bars<=Max_Period) return(0);

   i=Bars-Max_Period;
   if(counted_bars>Max_Period) i=Bars-counted_bars-1;
   while(i>=0)
   {

      double M1, M1b;
      double M2, M2b;

      M1 = MiddlePrice(TM_Period_1,i);
      M1b = MiddlePrice(TM_Period_1,i+TM_Shift_1);
      M2 = MiddlePrice(TM_Period_2,i);
      M2b = MiddlePrice(TM_Period_2,i+TM_Shift_2);

      //
      double diff1 = (M1-M1b); // up or down on short term;
      double diff2 = (M2-M2b); // up or down on longer term.
      // each has three choices, hence six possibilities.


      if (diff1*diff2 <= 0.0) { // opposite signs
         Down_Histogram[i] = 0.0;
         Up_Histogram[i] = 0.0;
      } else {
         double diff = 0.5* (M1+M2 - M1b-M2b);
         if (diff >= 0) {
            Up_Histogram[i]=diff;
            Down_Histogram[i]=0.0;
         } else {
            Up_Histogram[i] = 0.0;
            Down_Histogram[i]=diff;
         }
      }


      i--;
   }

   return(0);
}

double MiddlePrice(int nback, int shift) {
  double H = High[Highest(NULL,0,MODE_HIGH,nback,shift)];
  double L = Low[Lowest(NULL,0,MODE_LOW,nback,shift)];
  return( 0.5*(H+L));

}
Comments