TrendStrength_v2
Download script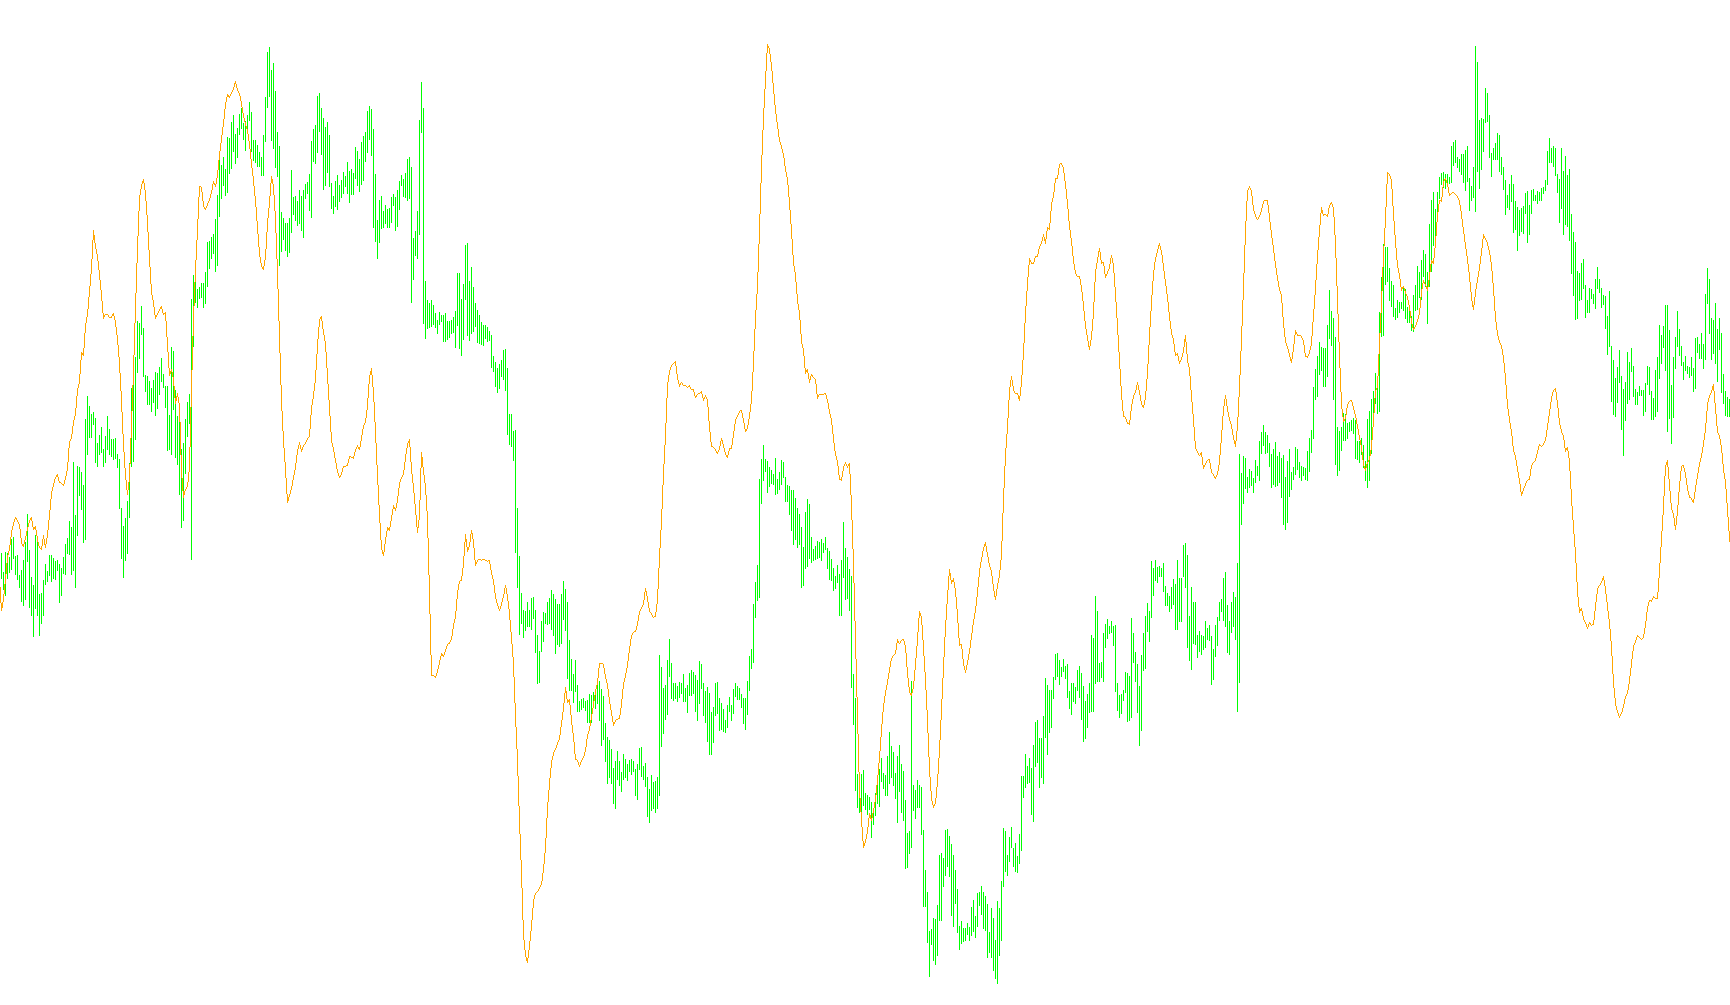
This tool is designed to help traders visualize the momentum and "strength" of a market trend by analyzing how price averages change over different time horizons. Rather than looking at a single price point, it evaluates the relationship between short-term movements and longer-term historical data.
How the Logic Works
The core logic of this indicator relies on comparing a very fast moving average against a series of progressively slower moving averages. Here is the step-by-step breakdown of how it processes market data:
- Baseline Selection: The script first identifies a primary short-term average (specifically a 5-period simple moving average). This acts as the "current" reference point for the immediate price action.
- Comparative Analysis: It then takes that short-term baseline and subtracts several different longer-term averages from it. These longer averages represent various historical windows (ranging from 10 to 90 periods). By subtracting these larger values from the smaller one, the script determines how much the current price "leads" or "lags" behind its own history.
- Data Aggregation: The tool calculates nine distinct differences based on those various timeframes. It then combines all of these results into a single average value.
- Visual Output: This final calculation is plotted as an orange line in a separate window at the bottom of your trading chart.
What This Tells the Trader
By aggregating these multiple timeframes, the indicator provides a smoothed look at trend intensity:
- Trend Strength: When the line moves significantly above or below the zero mark, it indicates that the current price movement is strongly deviating from its historical average, suggesting a powerful trend is in effect.
- Momentum Confirmation: Because it uses multiple averages (from 10 to 90), the indicator helps filter out minor market "noise." It requires the short-term price action to be consistently moving relative to the long-term history before showing significant strength.
- Trend Exhaustion: When the line flattens out or moves back toward the zero level, it can signal that the current momentum is fading, potentially indicating a period of consolidation or a reversal in the market trend.
Indicators Used
Miscellaneous
12
Views
0
Downloads
0
Favorites
TrendStrength_v2
//+------------------------------------------------------------------+
//|                                                TrendStrength.mq4 |
//|                                                        Xaoc 2006 |
//|                                             http://forex.xcd.ru/ |
//+------------------------------------------------------------------+
#property copyright "][aoc 2006"
#property link      "http://forex.xcd.ru/"

#property indicator_separate_window
#property indicator_buffers 1

#property indicator_color1 Orange
#property indicator_level1 0
//#property indicator_maximum 0.02
//#property indicator_minimum -0.02

double TS[];


//+------------------------------------------------------------------+
//| Custom indicator initialization function                         |
//+------------------------------------------------------------------+
int init()
  {
   IndicatorBuffers(1);

   IndicatorShortName("TrendStrength");

   SetIndexBuffer(0,TS);
   SetIndexStyle(0, DRAW_LINE, STYLE_SOLID, 1, Orange);
   SetIndexDrawBegin(0,2);
   SetIndexLabel(0,"TS");

//---- indicators
//----
   return(0);
  }
//+------------------------------------------------------------------+
//| Custor indicator deinitialization function                       |
//+------------------------------------------------------------------+
int deinit()
  {
//---- TODO: add your code here

//----
   return(0);
  }
//+------------------------------------------------------------------+
//| Custom indicator iteration function                              |
//+------------------------------------------------------------------+
int start()
  {
   int    shift,counted_bars=IndicatorCounted();
   //double ma40dbl;
   double ma0, ma1, ma2, ma3, ma4, ma5, ma6, ma7, ma8, ma9, tmp;
//---- TODO: add your code here


  //---- check for possible errors
     if(counted_bars<0) return(-1);
  //---- last counted bar will be recounted
     if(counted_bars>0) counted_bars--;
     //limit=Bars-counted_bars;
  //---- main loop
//---- main calculation loop
   shift=Bars-1;
   while(shift>=0)
     {
   tmp=iMA(NULL,0,5,0,MODE_SMA,PRICE_CLOSE,shift);
   ma1=tmp-iMA(NULL,0,10,0,MODE_SMA,PRICE_CLOSE,shift);
   ma2=tmp-iMA(NULL,0,20,0,MODE_SMA,PRICE_CLOSE,shift);
   ma3=tmp-iMA(NULL,0,30,0,MODE_SMA,PRICE_CLOSE,shift);
   ma4=tmp-iMA(NULL,0,40,0,MODE_SMA,PRICE_CLOSE,shift);
   ma5=tmp-iMA(NULL,0,50,0,MODE_SMA,PRICE_CLOSE,shift);
   ma6=tmp-iMA(NULL,0,60,0,MODE_SMA,PRICE_CLOSE,shift);
   ma7=tmp-iMA(NULL,0,70,0,MODE_SMA,PRICE_CLOSE,shift);
   ma8=tmp-iMA(NULL,0,80,0,MODE_SMA,PRICE_CLOSE,shift);
   ma9=tmp-iMA(NULL,0,90,0,MODE_SMA,PRICE_CLOSE,shift);

   TS[shift]=(ma1+ma2+ma3+ma4+ma5+ma6+ma7+ma8+ma9)/9;

     shift--;//
     }

//----
   return(0);
  }
//+------------------------------------------------------------------+
Comments