TradeSig_v5
Download script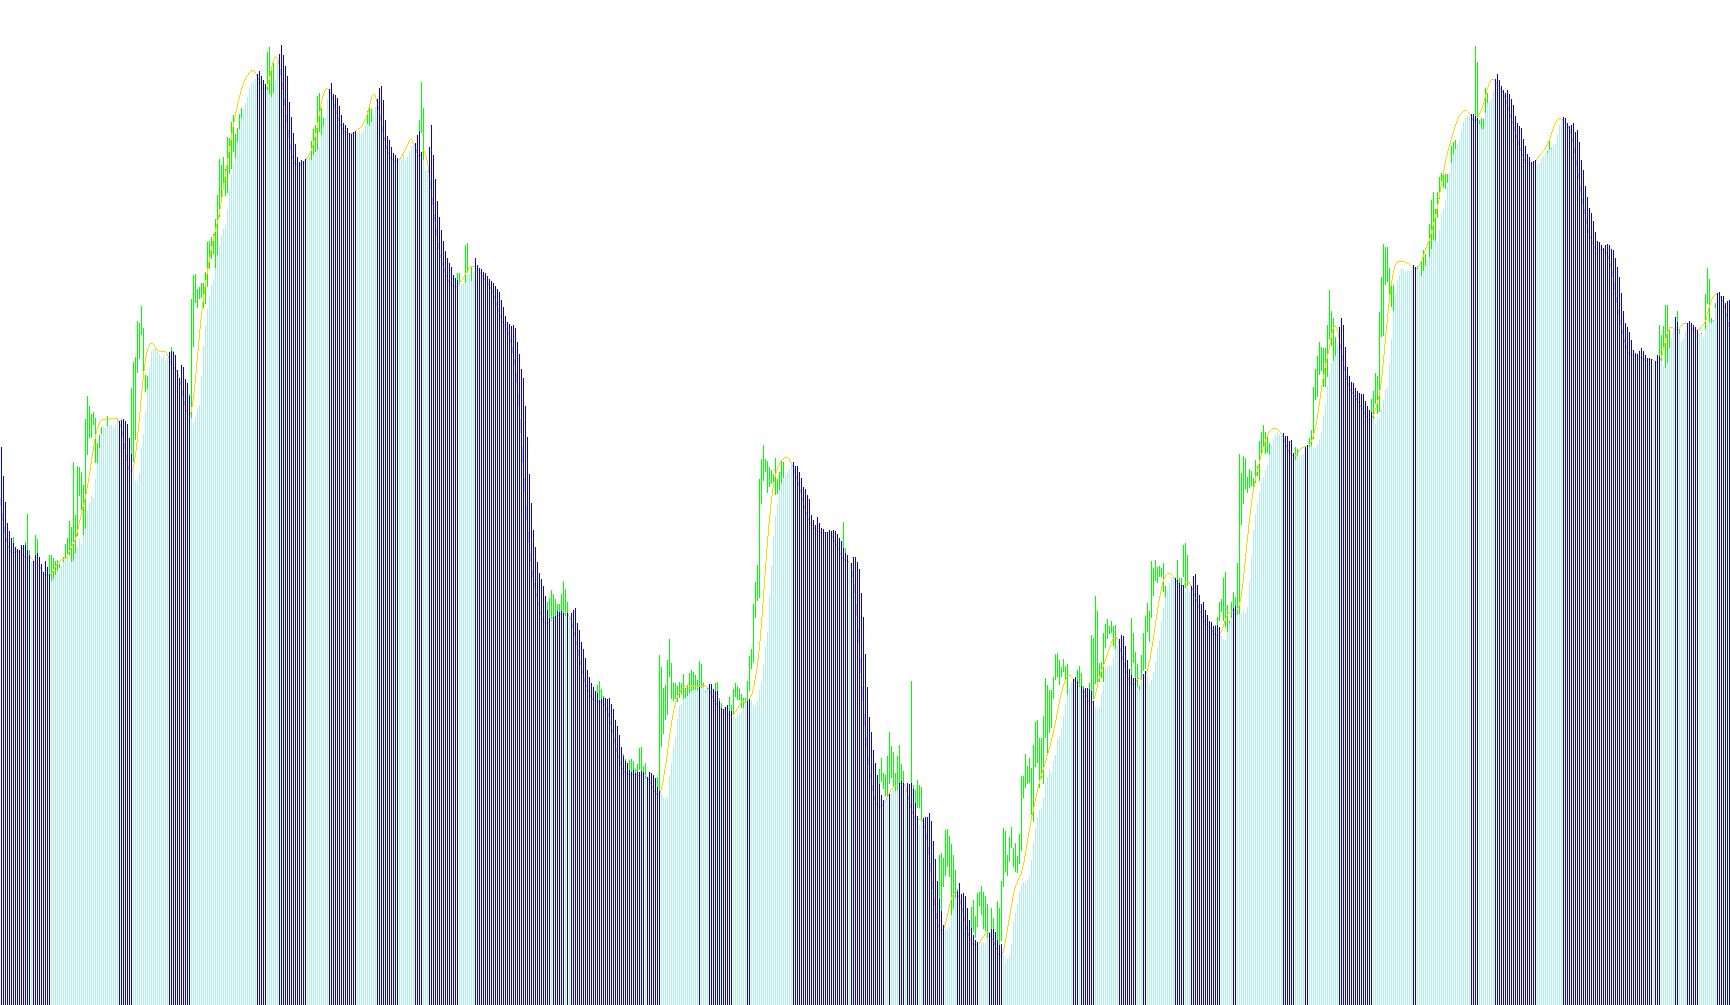
This technical indicator is designed to provide visual market analysis by identifying trends and potential price momentum through the interaction of several moving averages. Instead of looking at raw price action alone, it processes data to smooth out "noise," making it easier for a trader to see the underlying direction of the market.
Core Logic Overview
The tool operates by calculating three distinct visual components that appear in a separate window on your trading platform:
- The Primary Trend Line: The script calculates a sophisticated, multi-layered moving average. It takes a standard exponential moving average and passes it through a series of smoothing filters (weighted calculations). This creates a highly refined trend line that reacts to price changes with a balanced level of sensitivity—not so fast that it becomes erratic, but not so slow that it lags significantly behind current movements.
- The Reference Signal: The script tracks a second, slightly delayed moving average. By comparing the current refined trend to this secondary reference point, the indicator helps highlight the "velocity" or strength of the price movement.
- Dynamic Visual Cues: Finally, the tool uses a logic gate to compare the two primary values. When the refined trend exceeds the reference signal, it triggers a specific visual representation (a histogram). This helps traders quickly identify when momentum is shifting in a specific direction.
How It Works for the User
The indicator works by scanning past price data and applying mathematical weights to determine the current market "temperature."
- Smoothing: It takes the closing prices of recent candles and applies an exponential weight, meaning more recent prices have a higher impact on the current calculation than older ones.
- Layering: It then runs those averages through multiple stages of calculation (resembling a "nested" smoothing effect). This ensures that the resulting line represents a stable trend rather than a jagged reaction to minor price fluctuations.
- Comparison: By constantly measuring the distance between this refined trend and its historical reference point, the indicator provides a clear visual distinction between periods of active momentum and periods of consolidation.
In summary, this script serves as a trend-following tool that filters out market volatility to show you the "true" path of price movement, using a combination of weighted averages to highlight when the market is gaining significant strength.
//+------------------------------------------------------------------+
//|                                                        SmWPR.mq4 |
//|                      Copyright é 2006, MetaQuotes Software Corp. |
//|                                        http://www.metaquotes.net |
//+------------------------------------------------------------------+
#property copyright "Copyright é 2006, MetaQuotes Software Corp."
#property link      "http://www.metaquotes.net"

#property indicator_separate_window
#property indicator_buffers 3
#property indicator_color1 Gold
#property indicator_color2 Red
#property indicator_color3 DeepSkyBlue
//---- input parameters
extern int       per=8;
extern int       sdvig=5;
extern int       x_prd=0;
extern int       t3_period=8;
extern double    b=0.7;
//---- buffers
double ExtMapBuffer1[];
double ExtMapBuffer2[];
double ExtMapBuffer3[];

double e1, e2, e3, e4, e5, e6, c1, c2, c3, c4, n, w1, w2, b2, b3;
double shift, malim, mared, t3;
//+------------------------------------------------------------------+
//| Custom indicator initialization function                         |
//+------------------------------------------------------------------+
int init()
  {
//---- indicators

   SetIndexStyle(0,DRAW_LINE, STYLE_SOLID, 1);
   SetIndexBuffer(0,ExtMapBuffer1);
   SetIndexStyle(1,DRAW_HISTOGRAM, STYLE_SOLID, 1);
   SetIndexBuffer(1,ExtMapBuffer2);
   SetIndexStyle(2,DRAW_HISTOGRAM, STYLE_SOLID, 1);
   SetIndexBuffer(2,ExtMapBuffer3);

//----
   return(0);
  }
//+------------------------------------------------------------------+
//| Custom indicator iteration function                              |
//+------------------------------------------------------------------+
int start()
  {   int shift;
      b2=b*b;
      b3=b2*b;
      c1=-b3;
      c2=(3*(b2+b3));
      c3=-3*(2*b2+b+b3);
      c4=(1+3*b+b3+3*b2);
      n=t3_period;

      if (n<1) {n=1;}
      n = 1 + 0.5*(n-1);
      w1 = 2 / (n + 1);
      w2 = 1 - w1;

      /*for(int shift=Bars-1; shift>0; shift--)
      {
         ExtMapBuffer1[shift]=0;
         ExtMapBuffer2[shift]=0;
         ExtMapBuffer3[shift]=0;
      }*/

      for(shift=Bars-per; shift>0; shift--)
      {
         malim=iMA(NULL, 0, per, 0, MODE_EMA, PRICE_CLOSE,shift);
         mared=iMA(NULL, 0, per, 0, MODE_EMA, PRICE_CLOSE,shift+sdvig);

         e1 = w1*malim + w2*e1;
         e2 = w1*e1 + w2*e2;
         e3 = w1*e2 + w2*e3;
         e4 = w1*e3 + w2*e4;
         e5 = w1*e4 + w2*e5;
         e6 = w1*e5 + w2*e6;

         t3 = c1*e6 + c2*e5 + c3*e4 + c4*e3;


         ExtMapBuffer1[shift]=t3;
         ExtMapBuffer2[shift]=mared;
         if (t3>mared) {ExtMapBuffer3[shift]=mared;}
     }

   return(0);
  }
//+------------------------------------------------------------------+
Comments