TTF+-+MW_v1
Download script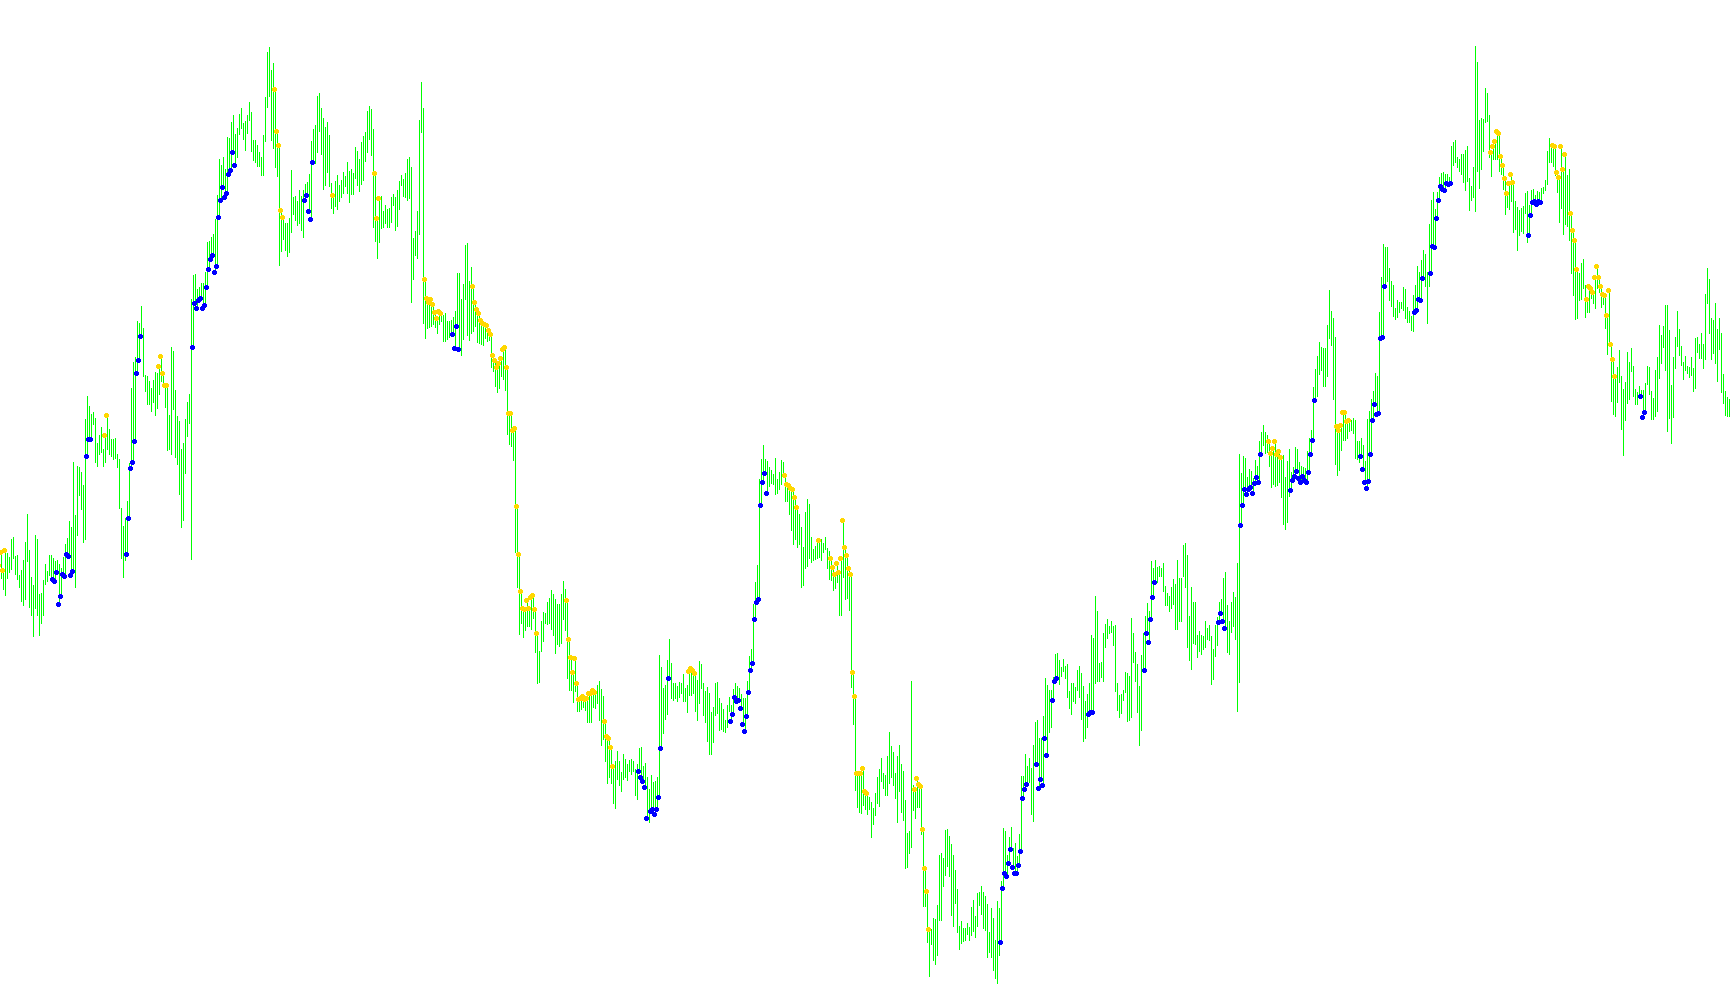
This script functions as a specialized technical analysis tool designed to identify significant momentum shifts in the marketplace by comparing recent price action against historical extremes. It aims to filter out market noise and pinpoint specific moments where buying or selling pressure becomes dominant enough to warrant attention.
Core Analytical Logic
The script operates by measuring "Power" in two opposing directions:
- Buying Power: The tool calculates this by identifying the highest price point reached in a very recent period and comparing it against the lowest price points of a slightly older period.
- Selling Power: Conversely, it identifies the highest price points of the older period and compares them against the lowest prices of the most recent period.
By calculating the difference between these two figures, the script determines which side—buyers or sellers—is currently "winning" the tug-of-war over the price.
Signal Processing and Smoothing
Rather than reacting instantly to every tiny price fluctuation, the script uses a multi-layered mathematical process to ensure the signals are reliable:
- Relative Percentage Calculation: It converts the raw difference between Buy Power and Sell Power into a percentage scale.
- Weighted Smoothing: The data passes through a series of sequential "weighted" calculations. This mimics a moving average effect, where recent data is given more importance than older data, helping to smooth out erratic "wiggles" in the chart.
- Fibonacci-Based Weighting: The script utilizes specific coefficients (inspired by Fibonacci sequences) to refine these smoothed values into a final indicator score.
Visual Output
The logic ultimately translates these complex calculations into simple visual cues on your trading chart:
- Sell Signals: When the calculated momentum score drops significantly below a certain threshold (indicating extreme selling pressure), the script places a specific marker above the candle.
- Buy Signals: When the score rises significantly above a certain threshold (indicating extreme buying pressure), the script places a corresponding marker below the candle.
- Neutral Zones: If the momentum is balanced and does not hit these extreme thresholds, no markers are displayed, allowing you to ignore periods of consolidation or indecision.
//+------------------------------------------------------------------+
//|                                                          TTF.mq4 |
//|                                                           MojoFX |
//|                                         http://fx.studiomojo.com |
//+------------------------------------------------------------------+
#property copyright "MojoFX"
#property link      "http://fx.studiomojo.com"
//---- indicators setting
#property indicator_chart_window
#property indicator_buffers 2
#property indicator_color1 Red
#property indicator_color2 GreenYellow
//---- input parameters
extern int       TTFbars=12;
extern int       t3_period=6;
extern double    b=1.618;
//---- buffers
double ExtMapBuffer1[],ExtMapBuffer2[];
double b2,b3,c1,c2,c3,c4,e1,e2,e3,e4,e5,e6,w1,w2,TTF,r;
double HighestHighRecent,HighestHighOlder,LowestLowRecent,LowestLowOlder;
double BuyPower,SellPower;
//+------------------------------------------------------------------+
//| Custom indicator initialization function                         |
//+------------------------------------------------------------------+
int init()
  {

//---- indicators
   SetIndexStyle(0,DRAW_ARROW);
   SetIndexArrow(0,159);
   SetIndexBuffer(0,ExtMapBuffer1);
   SetIndexEmptyValue(0,0.0);
   SetIndexStyle(1,DRAW_ARROW);
   SetIndexArrow(1,159);
   SetIndexBuffer(1,ExtMapBuffer2);
   SetIndexEmptyValue(1,0.0);

//----
    b2=b*b;
    b3=b2*b;
    c1=-b3;
    c2=(3*(b2+b3));
    c3=-3*(2*b2+b+b3);
    c4=(1+3*b+b3+3*b2);

    r=t3_period;

    if (r<1) r=1;
    r = 1 + 0.5*(r-1);
    w1 = 2 / (r + 1);
    w2 = 1 - w1;

    e1=0;
	e2=0;
	e3=0;
	e4=0;
	e5=0;
	e6=0;
//----
    return(0);
  }
//+------------------------------------------------------------------+
//| Custor indicator deinitialization function                       |
//+------------------------------------------------------------------+
int deinit()
  {
//---- TODO: add your code here

//----
   return(0);
  }
//+------------------------------------------------------------------+
//| Custom indicator iteration function                              |
//+------------------------------------------------------------------+
int start()
  {
    int counted_bars=IndicatorCounted();
    if (counted_bars<0) return(-1);
    if (counted_bars>0) counted_bars--;
    int limit=Bars-counted_bars;

//----
   for(int i=limit; i>=0; i--)
      {
      HighestHighRecent=High[Highest(NULL,0,2,TTFbars,i-TTFbars+1)];
      HighestHighOlder =High[Highest(NULL,0,2,TTFbars,i+1)];
      LowestLowRecent =Low[Lowest(NULL,0,1,TTFbars,i-TTFbars+1)];
      LowestLowOlder =Low[Lowest(NULL,0,1,TTFbars,i+1)];
      BuyPower =HighestHighRecent-LowestLowOlder;
      SellPower=HighestHighOlder -LowestLowRecent;
      TTF=(BuyPower-SellPower)/(0.5*(BuyPower+SellPower))*100;

      e1 = w1*TTF + w2*e1;
      e2 = w1*e1 + w2*e2;
      e3 = w1*e2 + w2*e3;
      e4 = w1*e3 + w2*e4;
      e5 = w1*e4 + w2*e5;
      e6 = w1*e5 + w2*e6;

      TTF = c1*e6 + c2*e5 + c3*e4 + c4*e3;

      if (TTF <= (-100))
         {
         ExtMapBuffer1[i] = High[i]+4*Point;
         ExtMapBuffer2[i] = 0;
         }

      if (TTF >= 100)
         {
         ExtMapBuffer1[i] = 0;
         ExtMapBuffer2[i] = Low[i]-4*Point;
         }

      if (TTF>(-100) && TTF<100){
         ExtMapBuffer1[i]=0;
         ExtMapBuffer2[i]=0;
         }

      }

//----
   return(0);
  }
//+------------------------------------------------------------------+
Comments