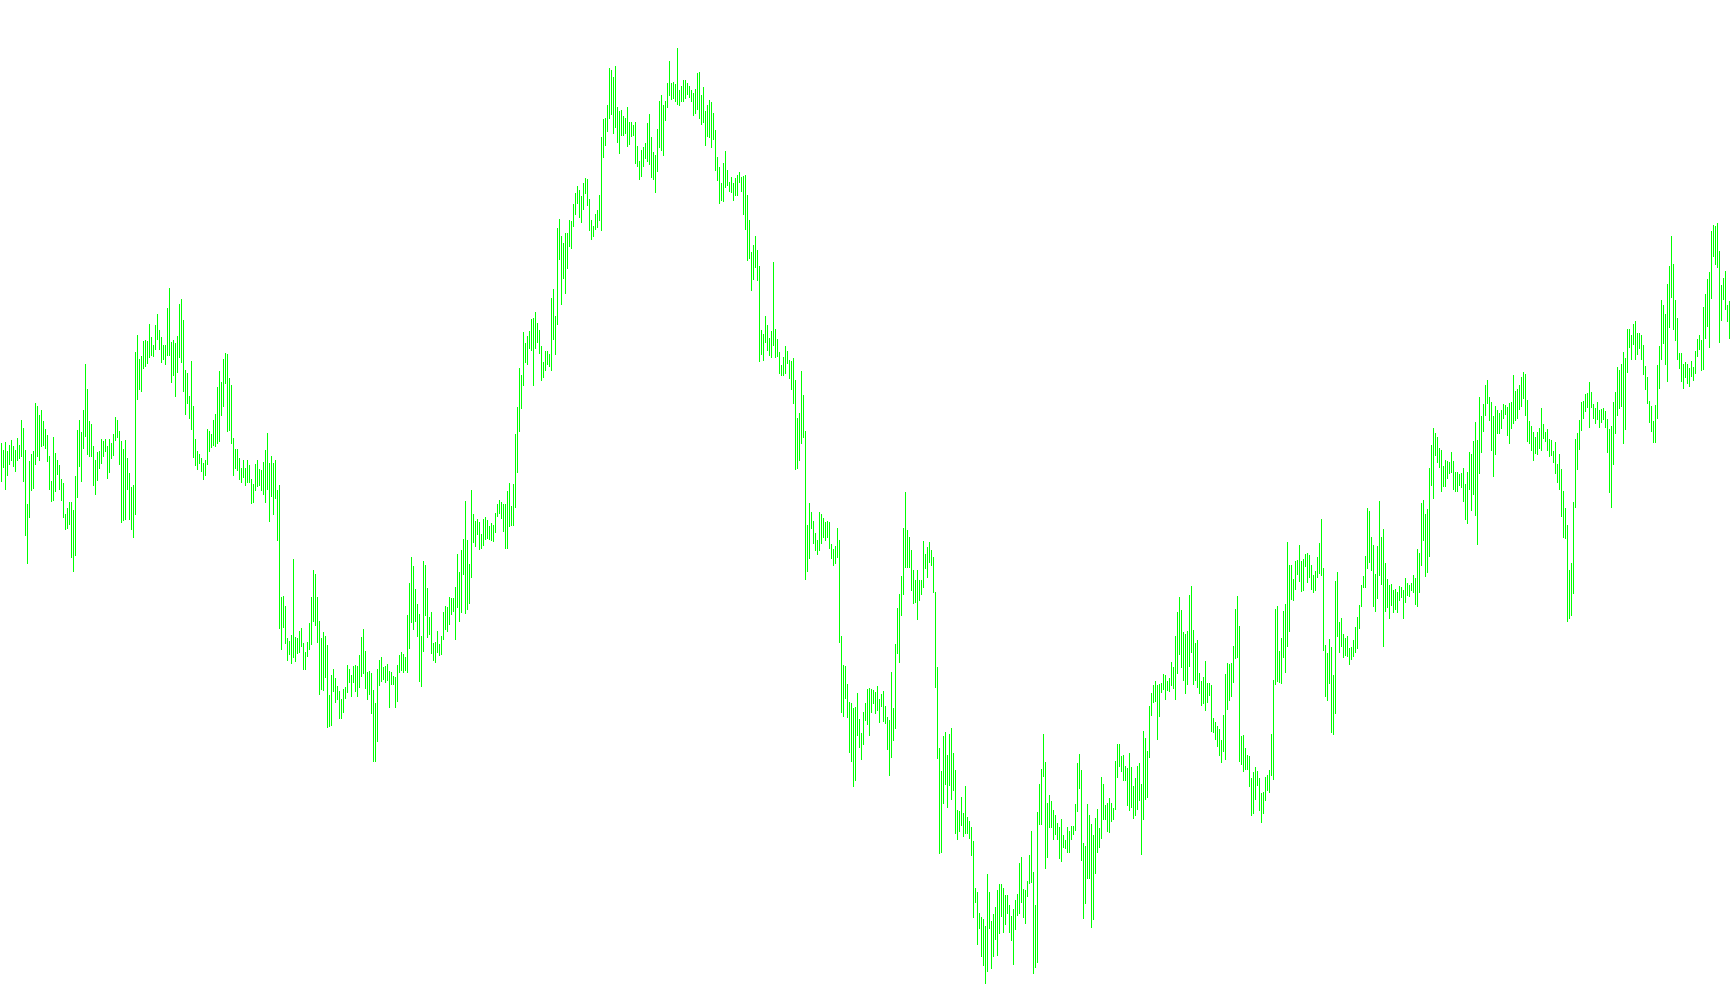
This tool is designed to help traders visualize market trends and identify potential price extremes by analyzing the relationship between current price action and historical moving averages. It simplifies complex data into three distinct visual components: an Upper Boundary, a Lower Boundary, and a Median line.
Core Logic & Methodology
The script operates by evaluating several different Simple Moving Averages (SMAs) simultaneously across various time intervals (determined by the user-defined "Period Step"). By looking at these multiple averages at once, the tool creates a "zone" of historical price behavior rather than relying on a single data point.
1. Identifying the Boundaries For every candle on the chart, the script calculates six different moving averages. It then scans these values to find the highest and lowest points among them:
- The Upper Boundary: Represents the highest peak reached by the various moving averages.
- The Lower Boundary: Represents the lowest valley reached by the moving averages.
2. Determining Trend Direction The script uses the current candle's high and low prices to "test" against these boundaries:
- Buy Signal Logic: If the current price breaks above the highest average (the Upper Boundary), the trend is flagged as bullish.
- Sell Signal Logic: If the current price drops below the lowest average (the Lower Boundary), the trend is flagged as bearish.
- Neutral Zone: If the price manages to span both boundaries simultaneously, the direction is neutralized, indicating a period of high volatility or indecision.
3. Visual Representation and Feedback The tool provides real-time feedback on your chart through three specific visual cues:
- Red Line (Upper Boundary): Highlights the ceiling based on the current trend analysis.
- Blue Line (Lower Boundary): Highlights the floor based on the current trend analysis.
- Silver Dotted Line (Median): Represents the exact midpoint between the high and low boundaries, providing a visual "fair value" area.
On-Screen Information
To make trading faster and more intuitive, the script also provides dynamic text updates in the corner of your screen. Depending on the current trend direction, it will automatically display:
- BUY/SELL Labels: Instantly tells you which way the trend is currently leaning.
- Price Levels: Shows the specific price value of the current boundary, helping you identify precise areas for potential entries or stop-loss placements.
// Ñèëà òðåíäà (ñòîï ëîññ).mq4
// Èíäèêàòîð

// Îïèñàíèå http://www.kroufr.ru/content/view/697/124/

#property copyright "mandorr@gmail.com"
#property indicator_chart_window
#property indicator_buffers 3
#property indicator_color1 Red
#property indicator_color2 Blue
#property indicator_color3 Silver

extern int PeriodStep=10;     // Øàã ïåðèîäà ñêîëüçÿùèõ
extern int CountBars=10000;   // Êîëè÷åñòâî îòîáðàæàåìûõ áàðîâ

double buffer0[];
double buffer1[];
double buffer2[];

void init()
   {
   SetIndexStyle(0,DRAW_LINE,STYLE_SOLID,2);
   SetIndexBuffer(0,buffer0);
   SetIndexLabel(0,"Âåðõíÿÿ ãðàíèöà");
   SetIndexDrawBegin(0,0);

   SetIndexStyle(1,DRAW_LINE,STYLE_SOLID,2);
   SetIndexBuffer(1,buffer1);
   SetIndexLabel(1,"Íèæíÿÿ ãðàíèöà");
   SetIndexDrawBegin(1,0);

   SetIndexStyle(2,DRAW_LINE,STYLE_DOT,1);
   SetIndexBuffer(2,buffer2);
   SetIndexLabel(2,"Ìåäèàíà");
   SetIndexDrawBegin(2,0);

   IndicatorShortName("Ñèëà òðåíäà (ñòîï ëîññ) ("+PeriodStep+")");
   }

void deinit()
   {
   Comment("");
   }

void start()
   {
   int dir=0;
   int step=1; if (PeriodStep>1) step=PeriodStep;
   double h, l, x1, x2, x3, x4, x5, x6;
   for (int i=CountBars-1; i>=0; i--)
      {
      x1=iMA(NULL,0,1*step,0,MODE_SMA,PRICE_CLOSE,i);
      x2=iMA(NULL,0,2*step,0,MODE_SMA,PRICE_CLOSE,i);
      x3=iMA(NULL,0,3*step,0,MODE_SMA,PRICE_CLOSE,i);
      x4=iMA(NULL,0,4*step,0,MODE_SMA,PRICE_CLOSE,i);
      x5=iMA(NULL,0,5*step,0,MODE_SMA,PRICE_CLOSE,i);
      x6=iMA(NULL,0,6*step,0,MODE_SMA,PRICE_CLOSE,i);
      h=x1;
      l=x1;
      if (h<x2) h=x2;
      if (h<x3) h=x3;
      if (h<x4) h=x4;
      if (h<x5) h=x5;
      if (h<x6) h=x6;
      if (l>x2) l=x2;
      if (l>x3) l=x3;
      if (l>x4) l=x4;
      if (l>x5) l=x5;
      if (l>x6) l=x6;
      if (High[i]>h) dir= 1;
      if (Low [i]<l) dir=-1;
      if (High[i]>h && Low[i]<l) dir=0;
      buffer0[i]=EMPTY_VALUE;
      buffer1[i]=EMPTY_VALUE;
      if (dir<0) buffer0[i]=h;
      if (dir>0) buffer1[i]=l;
      buffer2[i]=(h+l)/2;
      }
   if (buffer0[0]!=EMPTY_VALUE) Comment("SELL; ñòîï ëîññ: "+DoubleToStr(buffer0[0],Digits));
   if (buffer1[0]!=EMPTY_VALUE) Comment("BUY; ñòîï ëîññ: "+DoubleToStr(buffer1[0],Digits));
   }
Comments